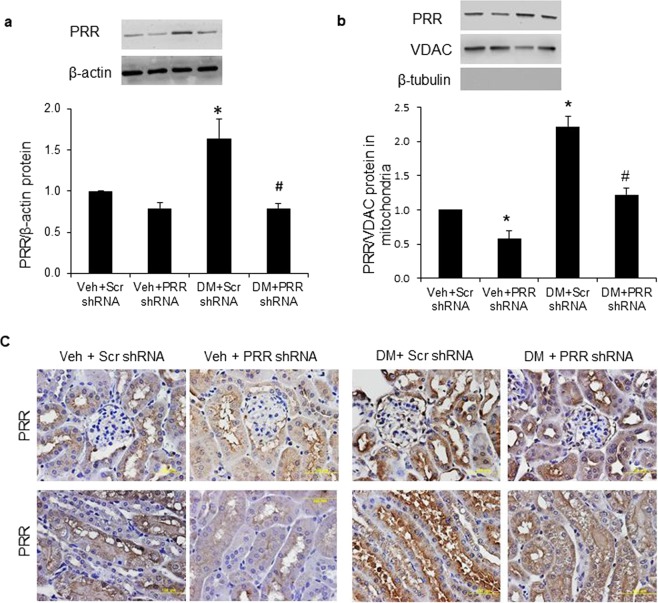
Figure 2.
Localization of PRR in kidney and renal mitochondria of normoglycemic and STZ-induced diabetic mice. (a) Western blot analysis of PRR protein expression in whole kidney lysate (n = 4, each group). (b) Western blot analysis of PRR protein expression in renal mitochondria fraction (n = 5, each group). (c) Representative images of PRR immunostaining (dark brown) in mice renal cortex (top panels) and tubules (bottom panels). PRR, (Pro)renin receptor; VDAC, Voltage-dependent anion channel; Veh + Scr shRNA, vehicle with scrambled PRR shRNA; Veh + PRR shRNA, vehicle with PRR shRNA; DM + Scr shRNA, diabetes with scrambled PRR shRNA; DM + PRR shPRR, diabetes with PRR shRNA. Data presented as mean ± SEM, *p < 0.05 vs. Veh + Scr shRNA; #p < 0.05 vs. DM + Scr shRNA.

