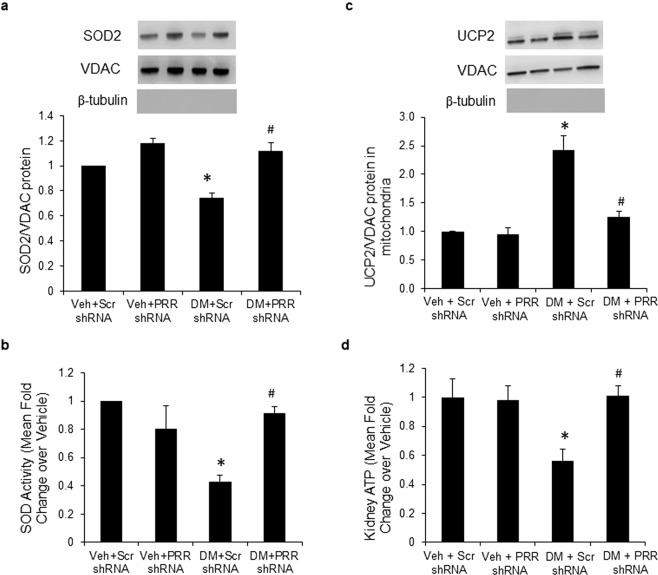
Figure 4.
SOD2 expression and activity, expression of UCP2 and ATP levels in renal mitochondria of normoglycemic and STZ-induced diabetic mice. (a) Western blot analysis of SOD2 protein expression in renal mitochondria fraction (n = 4, each group). (b) SOD2 activity in renal mitochondria fraction. (c) Western blot analysis of UCP2 protein expression in renal mitochondria fraction (n = 5, each group). (d) ATP levels in renal mitochondria fraction. PRR, (Pro)renin receptor; Veh + Scr shRNA, vehicle with scrambled PRR shRNA; Veh + PRR shRNA, vehicle with PRR shRNA; DM + Scr shRNA, diabetes with scrambled shRNA; DM + PRR shRNA, diabetes with PRR shRNA. Data presented as mean ± SEM, *p < 0.05 vs. Veh + Scr shRNA; #p < 0.05 vs. DM + Scr shRNA.

