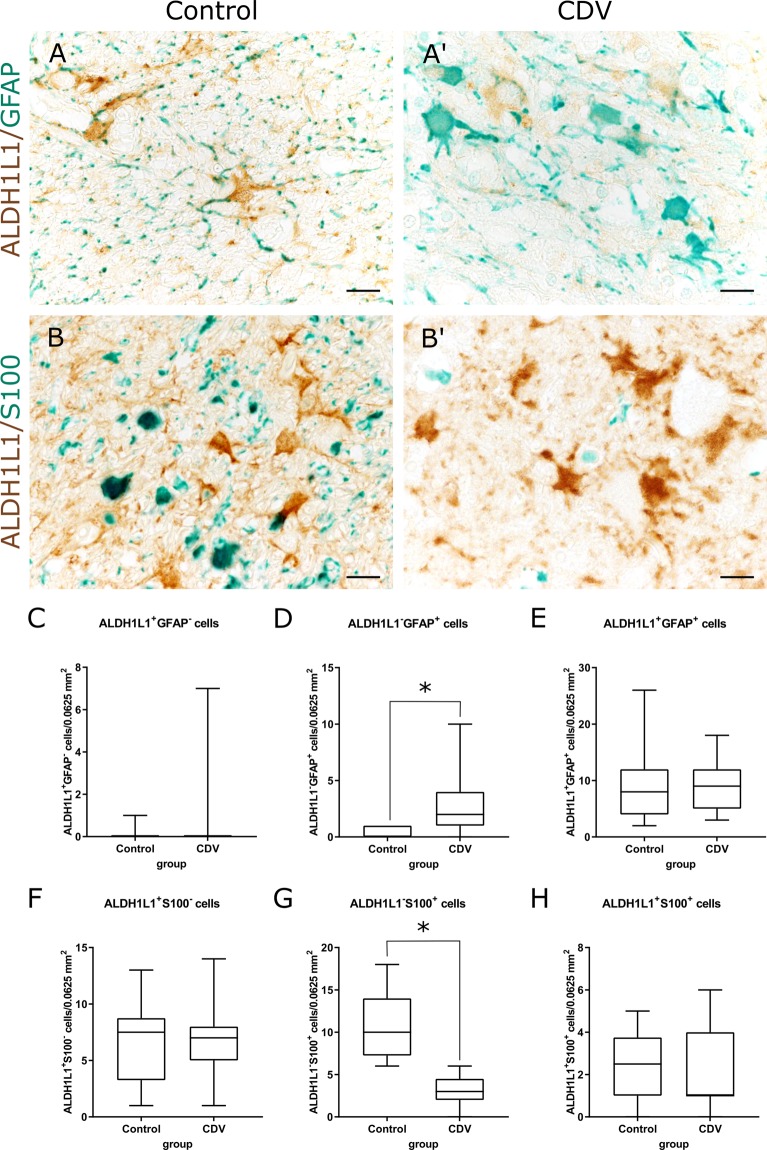
Figure 5.
Immunohistochemistry double labeling of astrocytic markers in the cerebellar white matter. (A,A′) Detection of ALDH1L1 (brown) and GFAP (green) in tissue of a control animal (A) and a CDV-infected dog (A′). Infection results in increased GFAP protein positivity. Scale bars = 20 µm. (B,B’) Detection of ALDH1L1 (brown) and S100 (green) in tissue of a control animal (B) and a CDV-infected dog (B’). Infected animals show loss of S100 signal. Scale bars = 20 µm. (C–E) Quantification of ALDH1L1+/GFAP− cells (C), ALDH1L1−/GFAP+ cells (D) and ALDH1L1+/GFAP+ double-positive cells (E). (F–H) Quantification of ALDH1L1+/S100− cells (F), ALDH1L1−/S100+ cells (G) and ALDH1L1+/S100+ cells double-positive cells (H). (C–H) Box and whisker plots display median and quartiles with maximum and minimum values. Significant differences (p ≤ 0.05, Mann–Whitney U-test) are labeled by asterisks.

