Figure 6.
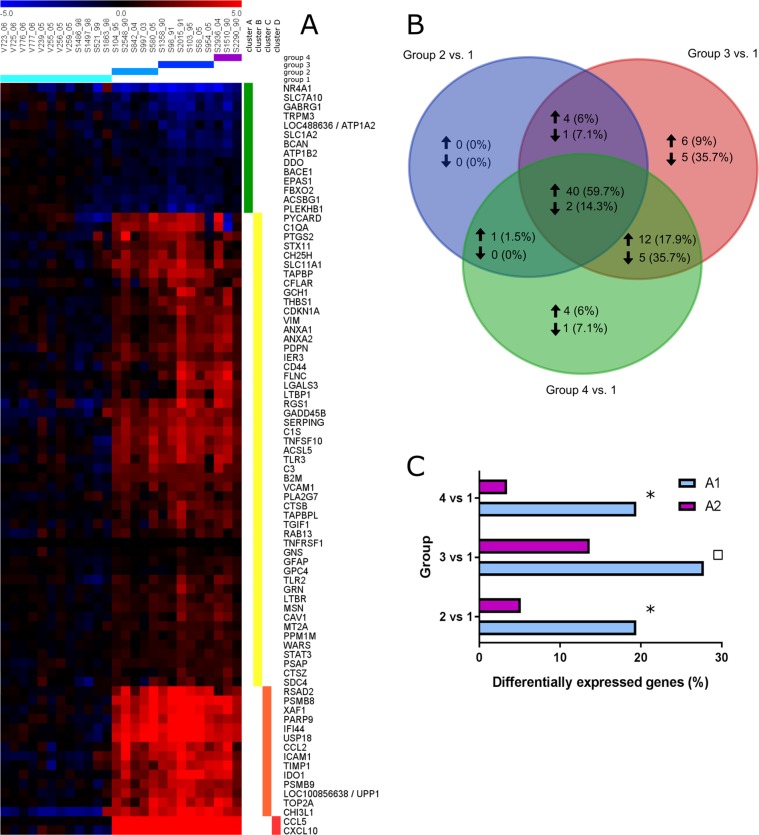
Astrocytic gene expression analyses. (A) Expression profile of 81 differentially expressed astrocyte-associated genes in the white matter during the course of CDV-induced demyelinating leukoencephalitis. The heat map displays log2-transformed individual fold changes relative to the mean expression of control animals indicated by a color scale ranging from −5 (relative low expression) in blue to 5 (relative high expression) in red. Each row represents one of 81 differentially expressed genes (DEGs) and each column one of the 26 biological replicates (cerebellar specimens of individual dogs) sorted according to the histologically defined groups of CDV-induced leukoencephalitis. Fold changes were grouped by hierarchical cluster analysis to reveal similar expression patterns. DEGs were subdivided into four clusters with distinct expression profiles: cluster A (green bar) contains downregulated genes, whereas cluster B (yellow bar) shows mildly upregulated genes, cluster C (orange bar) moderately upregulated and cluster D (red bar) severely upregulated genes. (B) Venn diagram comparing up- and downregulated astrocyte-related DEGs within the defined groups of CDV leukoencephalitis. Group 2–4 are compared for shared (intersection) and unique DEGs, depicted by total numbers and proportion (percentage). Upregulated genes are marked by an upward directed arrow, downregulated by a downward directed one. (C) Comparison of the relative proportion of A1- and A2-related differentially expressed genes employing the Fisher’s exact test revealed significant dominance of A1-related genes in group 2 and group 4. Significant differences (p ≤ 0.05) are labeled by asterisks. Statistical tendency is labeled by a square (p = 0.073).

