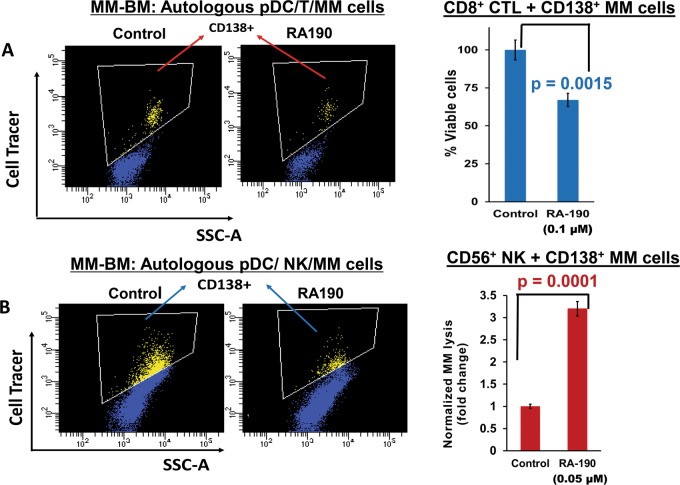
Fig. 2. Rpn13 blockade triggers pDC-induced MM-specific CD8+CTLs and NK cell-mediated lysis of MM cells.
a MM patient BM T cells were co-cultured with autologous pDCs (n = 8) at 1:10 (pDC:T cell) ratio in the presence or absence of RA190 (100 nM) for 3 days. After washing to remove RA190, cells were cultured with autologous MM cells pre-stained with CellTracker Violet (T/MM; 10:1 ratio) for 24 h, followed by 7-AAD staining and quantification of CTLs-mediated MM cell lysis by FACS. Left panel: Representative FACS scatter plot showing the decrease in number of viable CellTracker-positive MM cells. Right panel: Bar graph shows quantification of CD8+ CTLs-mediated MM cell lysis, reflected in CD138+ MM cell viability. Data were obtained from eight different MM patient BM samples (mean ± SD; p < 0.05). b MM patient BM NK cells were co-cultured with autologous pDCs at 1:10 (pDC:NK cell) ratio in the presence or absence of RA190 (50 nM) for 3 days. After washing to remove RA190, cells were cultured with autologous MM cells pre-stained with CellTrace violet (10:1 NK cell:MM cell ratio) for 24 h, followed by 7-AAD staining and quantification of MM cell lysis by FACS. Left Panel: Representative FACS scatter plot showing a decrease in number of viable CellTrace Violet-positive MM cells. Right Panel: Bar graph shows quantification of NK-mediated MM cell lysis. The fold change was normalized with control, and MM cell lysis in RA190-treated vs. -untreated is presented. Data were obtained from four different MM patient BM samples (mean ± SD; p < 0.05). Student’s t test was utilized to derive statistical significance, and the minimal level of significance was p < 0.05 (Graph Pad PRISM version 6, La Jolla, California, USA)

