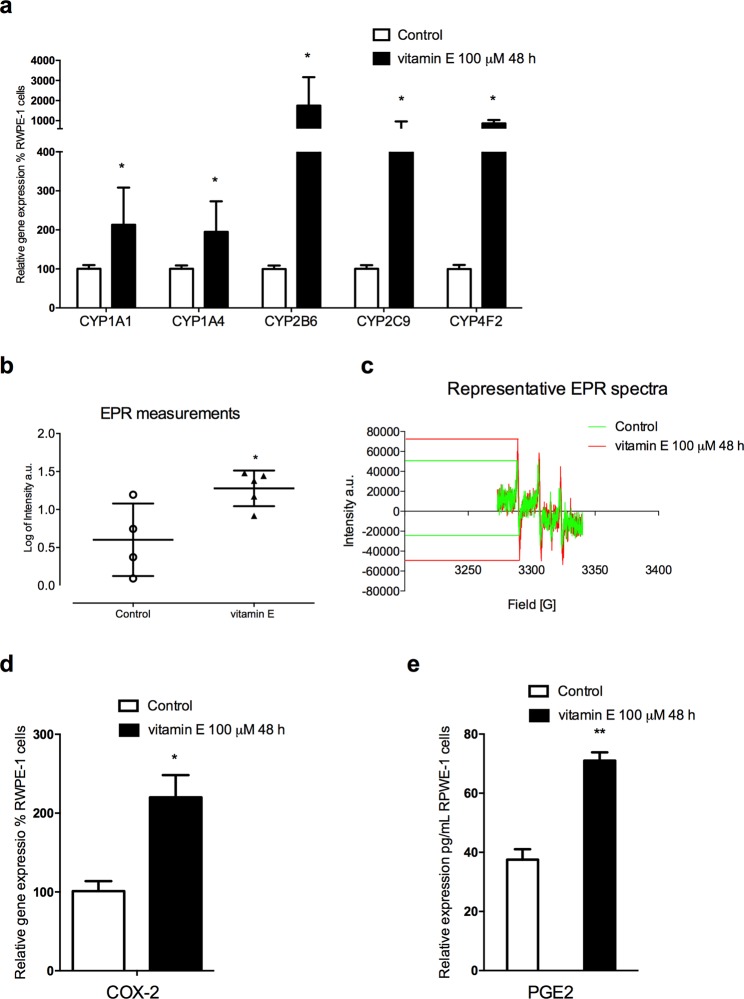
Figure 1.
Vitamin E in RWPE-1 cell line induces CYP gene expression coupled with increased ROS release and inflammation markers. (a) Gene expression study on RWPE-1 cells revealed sharp increments in mRNA levels from vitamin E-exposed cells compared to control. CYP1A1 and CYP1A4 are doubled (P < 0.05; n = 3). Isoforms 2B6, 2C9 and 4F2 showed the most pronounced changes with 18, 4 and 7 fold-higher levels respectively (P < 0.05; n = 3). (b) Free radical measurements through EPR spectroscopy in RWPE-1 cell line. The scattered dot plot represents total oxygen, nitrogen, and carbon-centered free radical species (arbitrary units) measured in RWPE-1 cells 48 hours after vitamin E exposure. Exposed cells (n = 5) exhibited significantly higher levels of radical species compared to controls (n = 4; P < 0.05). (c) Representative EPR spectra of nitroxide radicals observed in RWPE-1 control samples (green spectra), and in vitamin E-exposed samples (red spectra). EPR intensity of the first spectral line was used to obtain the relative amount of nitroxide in each sample examined. (d) Vitamin E-exposed cells (100 μM; 48 h) exhibited higher COX-2 mRNA levels (P < 0.05; n = 3). (e) COX-2 mRNA induction was coupled with an increased PGE2 secretion (P < 0.01; n = 3). Each bar represents the mean (±SD) P < 0.05, **P < 0.01 two-tailed t-test. (Control vs groups of each treatment).

