Figure 2.
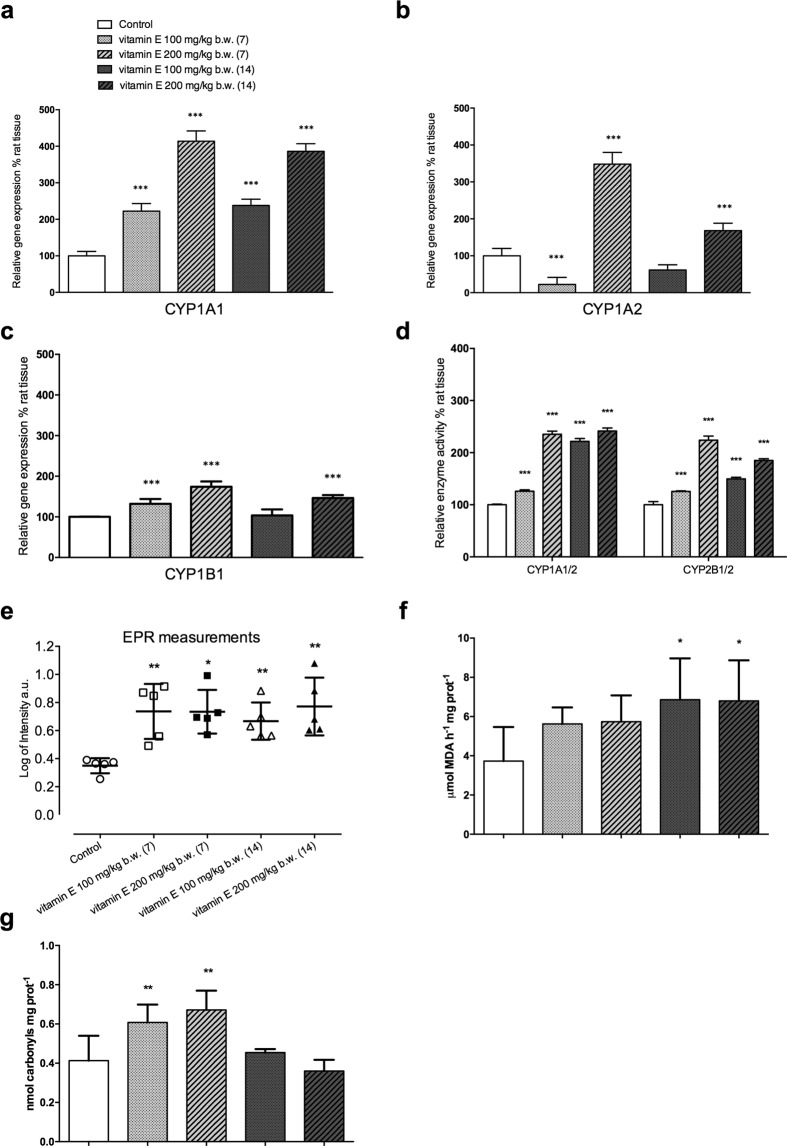
Vitamin E in rat prostate boosts CYP gene expression and linked enzymatic activities, and impairs the redox imbalance. (a) Data from RT-PCR analysis reported a marked increment of CYP1A1 throughout treatment (P < 0.001; n = 5). (b) CYP1A2 presented a non-linear pathway of modulation with a significant inhibition at the lowest dose (7 days) that was not confirmed after 14 days. 200 mg/kg b.w. led to a net upregulation at both time windows. (c) CYP1B1 showed a trend similar to that described for CYP1A1 although changes were milder. 100 mg/kg b.w. treatment showed a 32% (P < 0.001; n = 5) increment after 7 days that became non-significant at the fourteenth day. The highest dose resulted in 74 and 46% increments after 7 and 14 days, respectively (P < 0.001; n = 5). (d) CYP1A1/2-ethoxyresorufin O-deethylase increased from 26% at the lowest dosage for 7 days to more than 100% after 14 days of treatment. The highest dose more than doubled at both time windows. CYP2B1/2-pentoxyresorufin O-dealkylase rose from 26 to 124% (P < 0.01; n = 6), depending on the dose when vitamin E was administered for 7 days, whereas changes became less marked (about 85% and 50%) after 14 days(P < 0.0; n = 6). (e) EPR in prostate tissue biopsies from vitamin E-injected rats (both doses and time frames) reported significantly (P < 0.05; n = 5) higher levels of radical species compared to controls. (f) Data from TBARS assay plot indicated a general trend toward oxidative stress in prostate tissue of vitamin E-treated animals, even if only the 14-day treatment (both doses) reached statistical significance (P < 0.05; n = 6). (g) Carbonylated proteins showed a sharp increment when vitamin E was administered for 7 days (P < 0.01; n = 9), whereas, extending the treatment to 14 days led to an almost full recovery. Bars represent the mean (±SD). All data were analyzed by the ANOVA test corrected for multiple comparisons (Sidak post-hoc). *P < 0.05; **P < 0.01; ***P < 0.001 (Control vs groups of each treatment).

