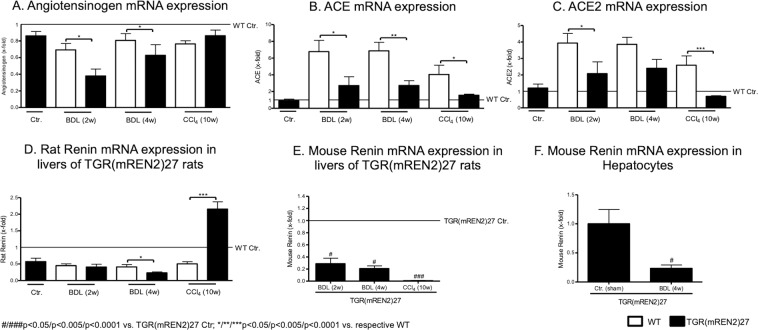
Figure 2.
Hepatic gene expression levels of the renin-angiotensin system in healthy and cirrhotic TGR(mREN2)27 rats. (A) Hepatic angiotensinogen mRNA expression in control, BDL (2w, 4w) and CCl4 (10w) intoxicated WT and TGR(mREN2)27 rats. All results were normalized to WT control data, which is shown as a line. Results are expressed as x-fold change. ACE mRNA expression in livers of WT and TGR(mREN2)27 rats. Results of uninjured and injured (BDL 2w, BDL 4w, CCl4 10w) rats are expressed as x-fold change to WT control data, which is illustrated as a line. mRNA levels of hepatic ACE2 expressed as x-fold level of transcription normalized to WT controls, shown as a line. (D) Rat renin mRNA expression in livers of WT and TGR(mREN2)27 rats. Results are expressed as x-fold change and normalized to WT controls, represented as a line. (E) Mouse renin mRNA expression in livers of uninjured TGR(mREN2)27 rats and after BDL (2w, 4w) and CCl4 10w. Results were normalized to uninjured control TGR(mREN2)27 data and expressed as x-fold change. (F) Mouse renin mRNA expression in hepatocytes of control (sham) and BDL (4w) TGR(mREN2)27 rats. Data are expressed as x-fold change of control TGR(mREN2)27 rats. Error bars are means ± s.e.m. Statistical analyzes; Mann-Whitney t-test. */**/***Indicates p < 0.05/p < 0.005/p < 0.0001 compared to respective WT data. #/##/###Indicates p < 0.05/p < 0.005/p < 0.0001 compared to TGR(mREN2)27 control data.

