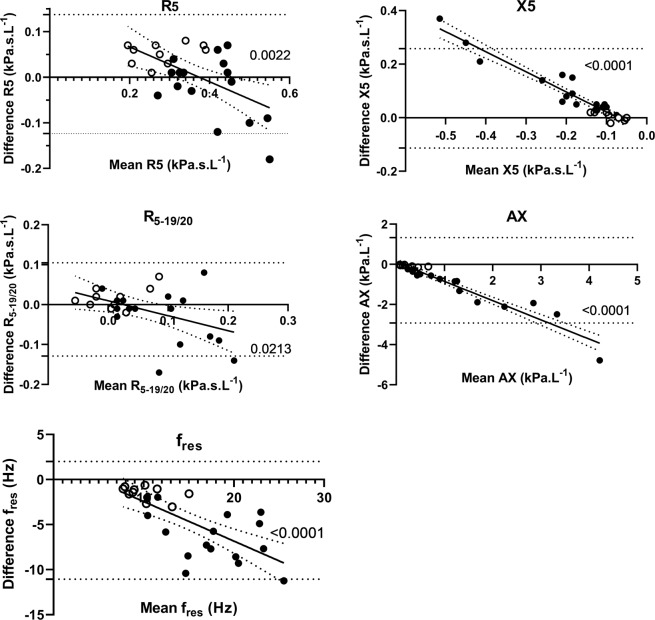
Figure 1.
Bland-Altman plots of R5, X5, R5-19/20, AX, and fres data obtained with IOS and tremoflo in COPD patients (solid symbols) and healthy control subjects (open symbols). A regression line was fitted to the data and the regression coefficient was calculated. The regression coefficients and associated p-values for the respective variables are; R5: r = −0.57; p = 0.0022; X5: r = −0.96; p = 0.0001; R5-19/20: r = −0.45; p = 0.0213 fres: r = −0.72; p = 0.00004; and AX: r = −0.96; p = 0.0001.

