
Figure 5.
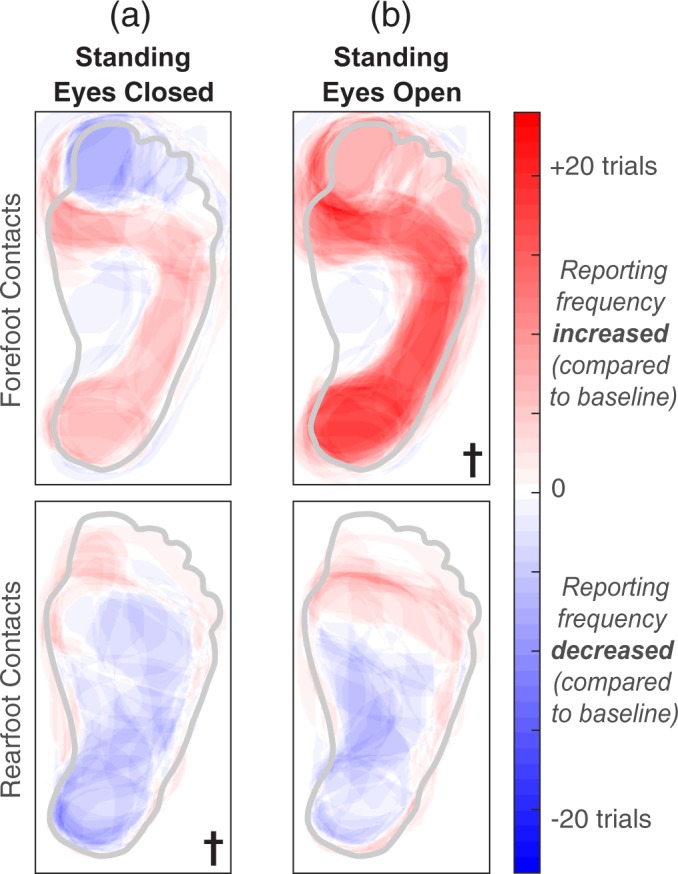
A generic healthy foot is outlined in grey. Shaded red areas indicate regions that were reported more than the baseline condition, and shaded blue regions represent a decrease in reporting compared to baseline. The † symbol indicates significant changes in percept reporting frequency and/or percept size over the entire plantar surface of the foot (two-tailed paired t-tests, p < 0.05). (a) Stimulation was delivered while participants stood upright with their eyes closed. (b) Stimulation was delivered while participants stood upright with their eyes open, looking down at their feet.