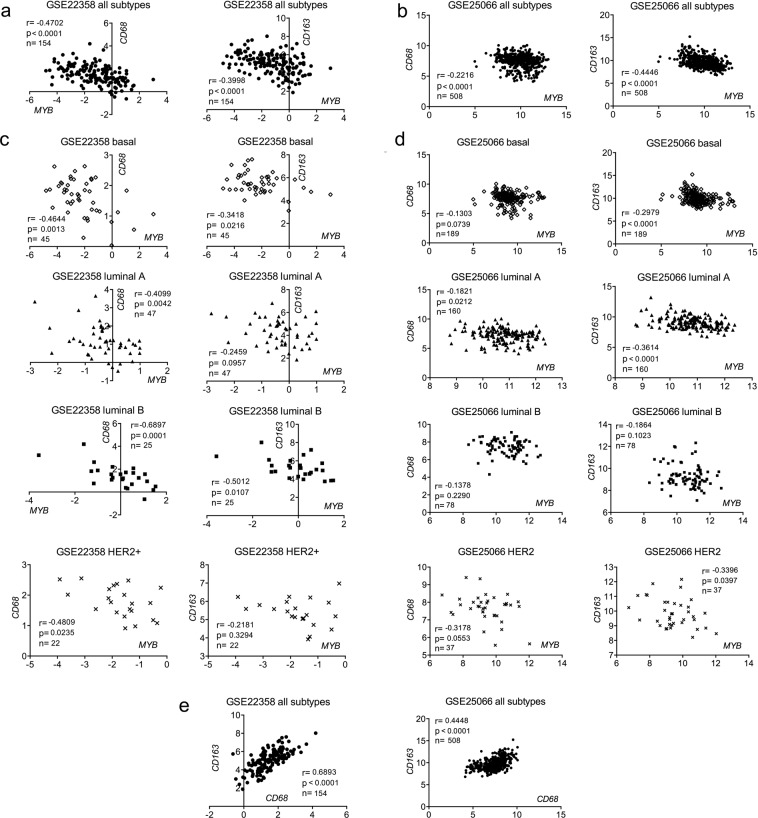
Figure 2.
Expression of MYB inversely correlates with CD68 and CD163 mRNAs in human BCs. Two datasets were used for correlation analysis: GSE22358 (left; a,c,e) and GSE25066 (right; b,d,e). Pearson correlation coefficients (r) between mRNA expression of indicated genes (MYB vs CD68, MYB vs CD163, and CD68 vs CD163), logrank p value and number of patients (n) are indicated in the graphs. Patients of all subtypes were included in a,b,e; and stratified according to the molecular subtypes (by the PAM50 classifier) in c,d.

