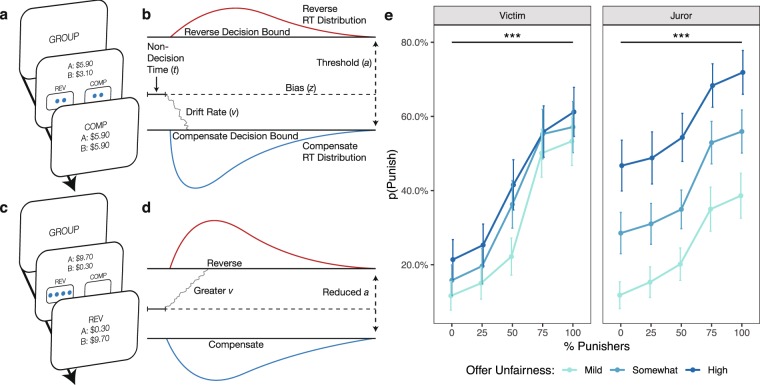
Figure 3.
Schematics and behavioral results of Experiments 3 and 4 (Victim and Juror). (a) As in the Last Decider study, subjects in Experiments 3 and 4 observed their group’s punishment preferences prior to indicating their own punishment preference. In this example, the group is evenly split between punishers and compensators. (b) According to the Drift Diffusion Model (DDM), people make decisions by noisily accumulating evidence in favor of each of the options until a decision bound is reached. In this cartoon schematic, subjects are biased such that they initially prefer compensation over punishment, indicated by the starting point z; they require some threshold of evidence in order to commit to a choice, indicated by a; and they accumulate evidence in favor of compensation, indicated by v. Together, these parameters dictate the shapes of reaction time distributions for punishment and compensation. (c) In this example trial, the group unanimously prefers to punish the unfair offer. (d) We illustrate using a cartoon schematic how conformity to the group underlie shifts in the v and a parameters, thereby changing choice and reaction time distributions. (e) When deciding as either a Victim or Juror, preference for punishment increases with the proportion of punishers, replicating Experiment 1 (Last Decider). Error bars reflect ± 1 SEM.

