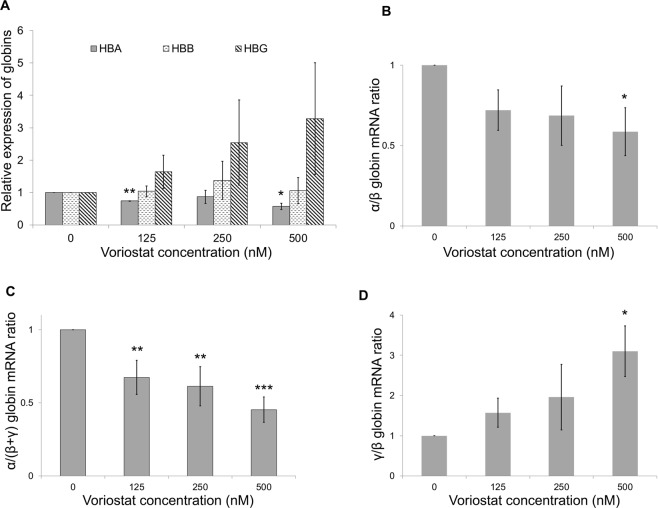
Figure 2.
Effects of vorinostat on globin gene expression in human erythroid cells. Erythroid cells differentiated from human adult CD34+ cells were incubated with a dose range (0–500 nM) of vorinostat for 72 hours on day 7 of the differentiation and globin gene expression was analysed using qRTPCR. (A) α, β and γ-globin expression relative to RPL13A expression. (B) α/β-globin mRNA ratio. (C) α/(β + γ) globin mRNA ratio. (D) γ/β-globin mRNA ratio. Mean expression levels from 3 independent biological repeats are shown; error bars represent SD; *p < 0.05, **p < 0.01 and ***p < 0.001 relative to the 0 nM concentration.

