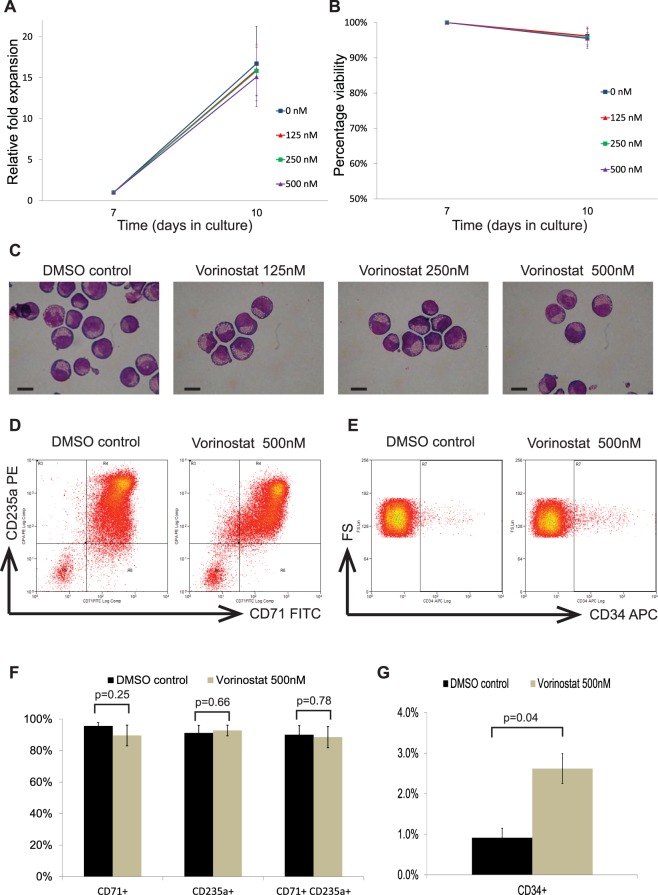
Figure 4.
Effects of vorinostat on erythroid cell expansion, viability and differentiation. Erythroid cells differentiated from human umbilical cord blood derived CD34+ cells were incubated with a dose range (0–500 nM) of vorinostat for 72 hours on day 7 of the differentiation and analysed on day 10. The 0 nM concentration refers to a DMSO control. (A) Cell growth shown as mean fold expansion relative to the number of cells on day 7. (B) Percentages of viable cells analysed by trypan blue test. (C) Representative cytospins of cells stained by modified Wright stain; scale bar – 10 μm. (D) Representative flow cytometry plots of cells stained with FITC-conjugated anti-CD71 and PE-conjugated anti-CD235a antibodies. (E) Representative flow cytometry plots of cells stained with APC-conjugated anti-CD34 plotted against forward scatter (FS). (F) Percentages of cells expressing CD71 and CD235a in vorinostat treated and control groups. (G) Percentage of cells expressing CD34 in vorinostat treated and control groups. In (A,B) and (F,G) means of 3 independent biological repeats are shown; error bars represent SD.

