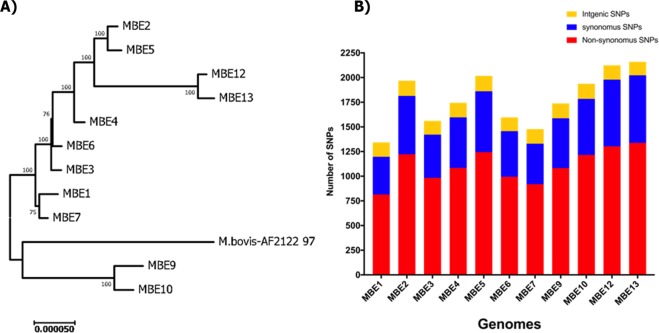
Figure 5.
Whole genome sequence analysis of SNPs of M. bovis isolates. (A) A phylogenetic tree inferred using the neighbor-joining method based on the predicted SNPs of each isolate compared with the M. bovis AF2122/97 reference genome. Numbers at each branch represent bootstrap values and branches correspond to partitions with >50% bootstrap replicates. The tree is drawn to a scale with evolutionary distances computed using the maximum composite likelihood method in MEGA7. (B) Histogram of the number of SNPs (synonymous, non-synonymous and intergenic) for each examined M. bovis isolate compared to the reference genome.

