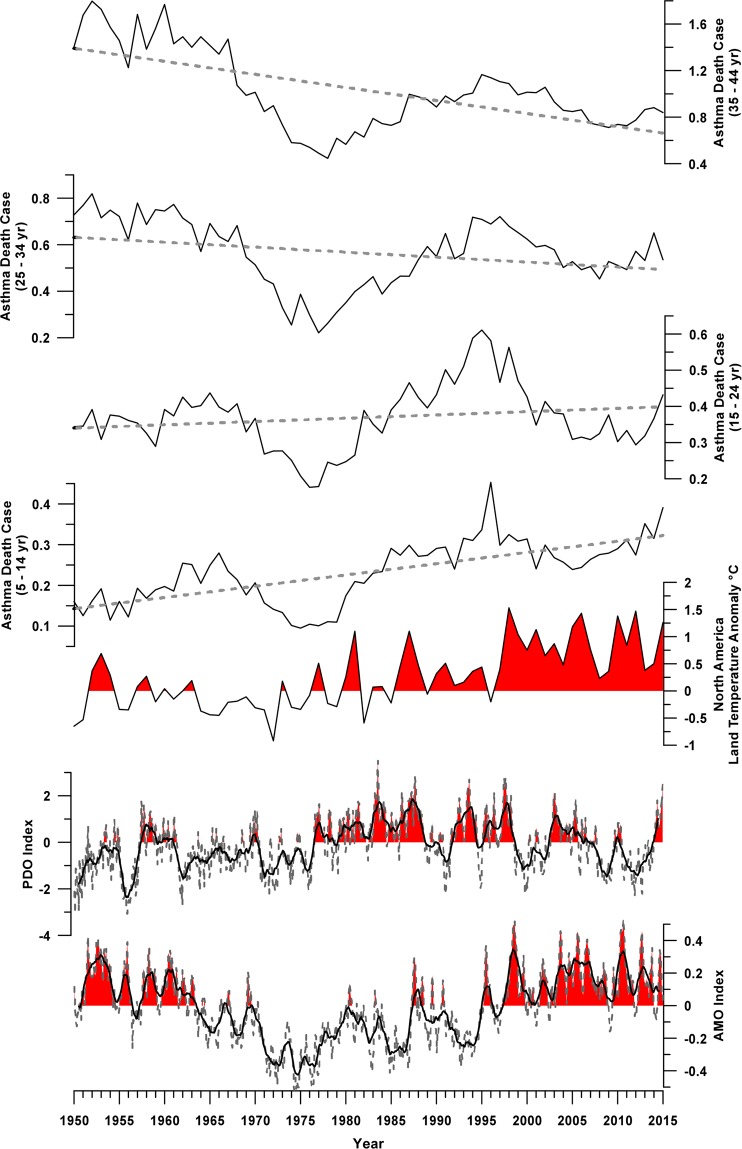
Figure 1.
Comparison in time domain between the month (grey dashed lines) and annual mean data (black plain lines) of the Atlantic Multidecadal Oscillation, and Pacific Decadal Oscillation were reported. Annual mean data of the North America Land Temperature Anomaly was reported. Red infill indicate values above zero. Annual asthma mortality death rates for the 4 selected age groups (5–14 yr, 15–24 yr, 25–34 yr, 35–44 yr), grey dashed lines represent linear trends.

