Figure 5.
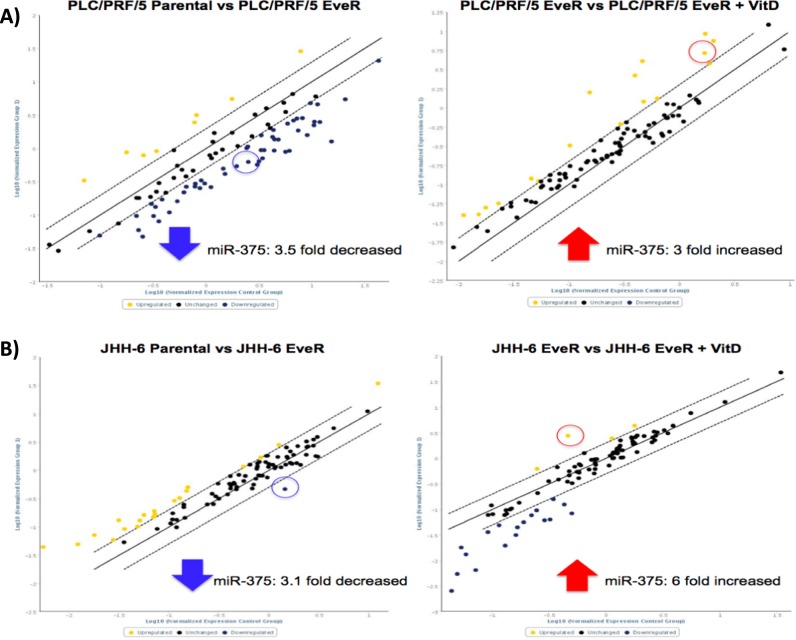
Fold regulation of human liver miRNAs in HCC cells. (A) PLC/PRF/5 Parental vs PLC/PRF/5 EveR and PLC/PRF/5 EveR vs PLC/PRF/5 EveR + VitD; (B) JHH-6 Parental vs JHH-6 EveR and JHH-6 EveR vs JHH-6 EveR + VitD. Generated scatter plot compares the normalized expression of every miRNA on the array between two groups by plotting them against one another to quickly visualize large miRNA expression changes. The central line indicates unchanged miRNAs expression. The lateral dotted lines represent the selected boundaries. miRNAs whose expression changes are greater than the selected boundaries will be listed as significant up- or down- regulated miRNAs. Yellow dots represent up-regulated miRNAs while blue dots the down-regulated miRNAs. Dot in the circle represents miR-375.

