Fig. 5.
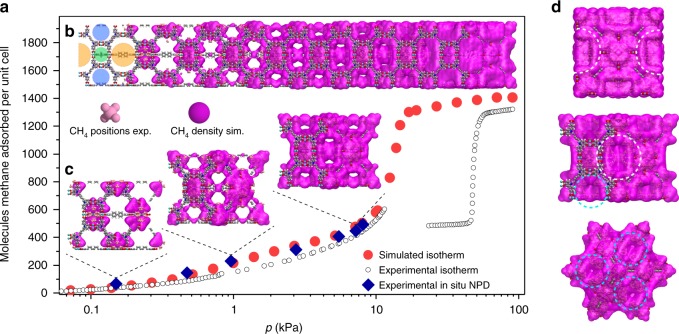
Methane distribution in DUT-49. a Simulated (red circles) and experimental (open symbols) methane adsorption isotherm of DUT-49 at 111 K including points at which NPD patterns were recorded (blue diamonds). b Structure of DUT-49 with increasing population of pores with methane upon pressure increase, including on the left trimodal pore system: octahedral (oct, orange), tetrahedral (tet, blue), cuboctahedral (cub, green). Experimentally refined methane positions in light pink, simulated methane density in pink. c Visualisation of DUT-49 unit cell at selected loadings which correspond to experimentally investigated pressure. d Illustration of methane-filled pores of DUT-49 unit cell in the region of NGA viewed along (100) direction (top), (110) direction (middle), and (111) direction (bottom). For detailed mechanism see Supplementary Movie 1

