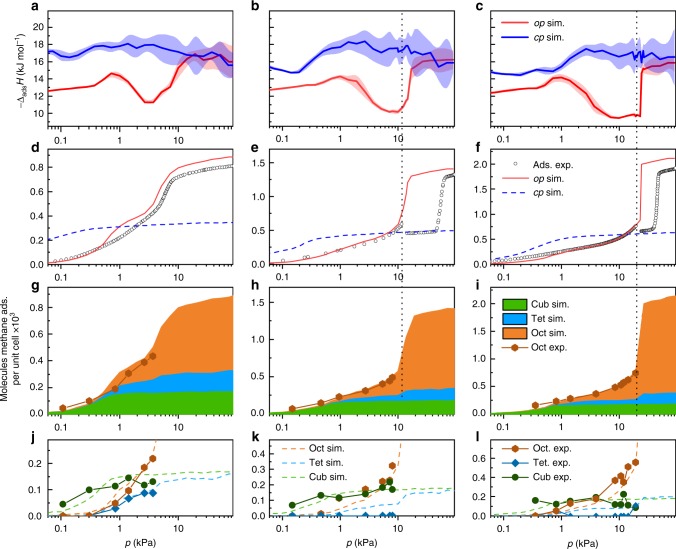
Fig. 6.
Analysis of adsorption mechanism. Columns represent DUT-48 (left), DUT-49 (middle), and DUT-50 (right). a–c Adsorption enthalpy profiles for op (red) and cp (blue). d–f Methane adsorption isotherms at 111 K experimental (circles), simulated for op (red) and cp (blue dashed line). g–i Stacked simulated isotherms of methane at 111 K for the cuboctahedral (green), tetrahedral (blue), and octahedral (orange) pores and experimentally obtained isotherms (orange hexagons). j–l Comparison of simulated (dashed lines) and experimental (symbols and solid lines) for the cuboctahedral (dark green), tetrahedral (dark blue), and octahedral (dark orange) pores. Vertical dashed black lines indicate the region of NGA for DUT-49 and -50

