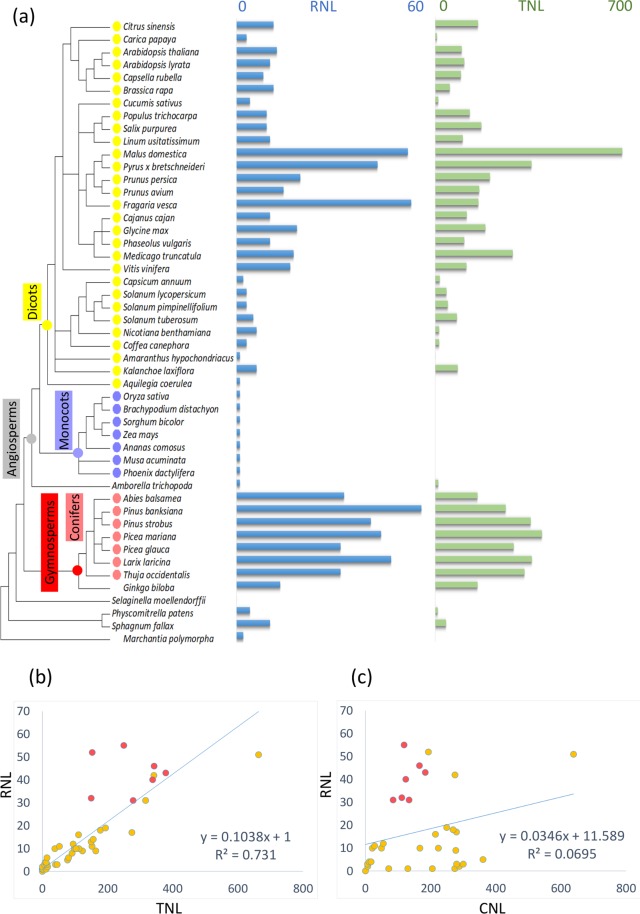
Figure 2.
Distribution of the RNL and TNL genes in 49 land plants. (a) RNL- and TNL-related sequence numbers are mapped to the species tree created from the NCBI Common Taxonomy Tree (https://www.ncbi.nlm.nih.gov/Taxonomy/CommonTree/wwwcmt.cgi). Abscissa axis represents the protein numbers situated above the diagram. (b) RNL versus TNL numbers. (c) RNL versus CNL numbers. Light red dots represent the conifer species used in this study. The linear regression equation and the R2 coefficient are indicated.

