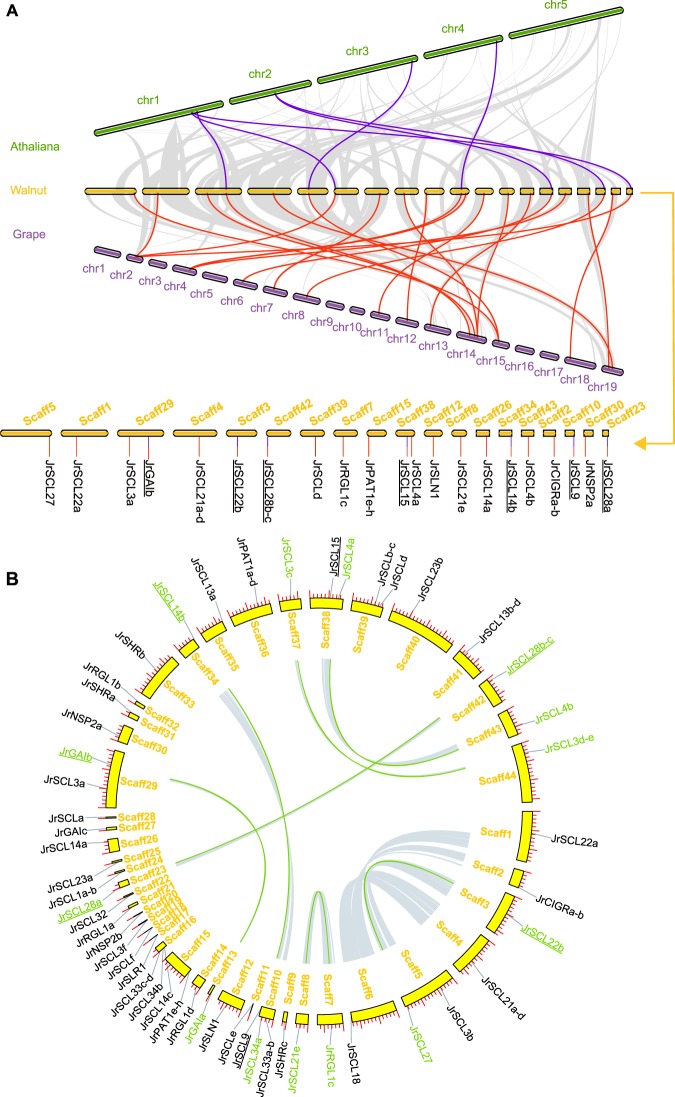
Figure 4.
(A) Synteny analysis of GRAS genes between Arabidopsis, walnut and grape. The gray lines in the background indicate the collinear blocks within walnut and other plant genomes, while the blue and red lines highlight the syntenic GRAS gene pairs. (B) Synteny analysis of JrGRAS genes. Gray lines indicate all synteny blocks in the walnut genome, whereas the green lines suggest duplicated GRAS gene pairs. The gene name with an underline means this gene was identified as the synteny gene between different species.

