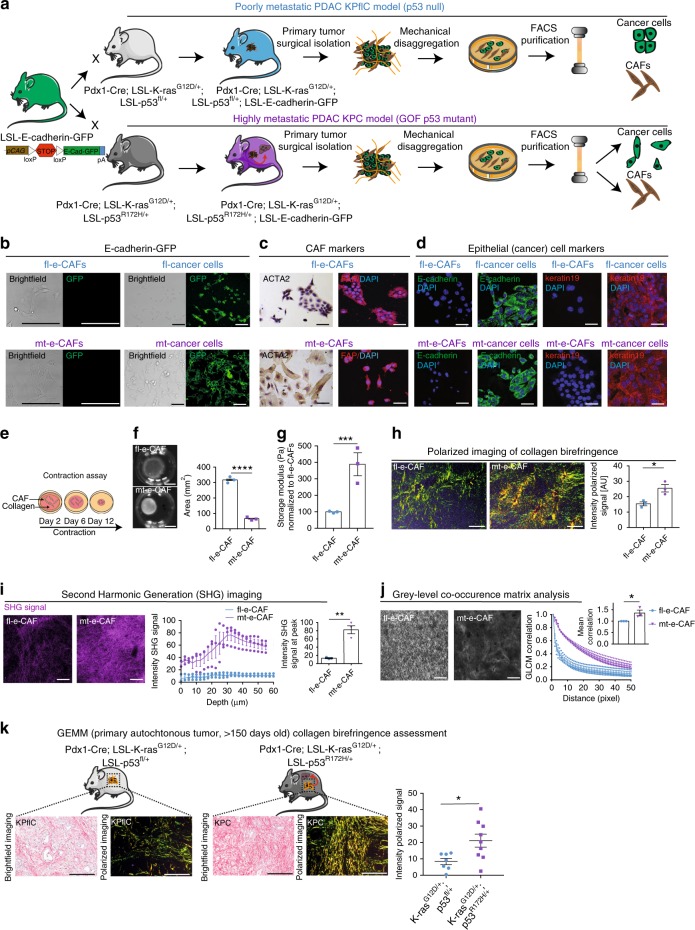
Fig. 1.
Isolation and characterization of CAFs from KPflC and KPC primary tumors. a Representation of isolation of cancer cells and CAFs from poorly metastatic KPflC (top panel) and highly metastatic KPC (lower panel) primary tumors using the previously generated LSL-E-cadherin-GFP mouse. b Brightfield and GFP imaging of cancer cells and CAFs isolated from E-Cadherin-GFP-KPflC tumors and from E-Cadherin-GFP-KPC tumors. Scale bar: 100 μm. c Immunocytochemistry staining of markers of CAF activation (ACTA2 α-smooth muscle actin; FAP fibroblast activated protein) in fl-e-CAFs and mt-e-CAFs. Scale bar: 100 μm. d Immunofluorescence staining of CAFs and cancer cells for markers of pancreatic epithelial cells (E-cadherin, keratin 19). Scale bar: 100 μm. e Representation of CAF-driven contraction assay. f Representative images of CAF-collagen matrices and quantification of matrix area following a 12-day contraction assay. Scale bar: 1 cm, n = 3 biological repeats with three technical replicates per biological repeat. g Shear rheology measurements of storage modulus of matrices remodeled by fl-e-CAFs or by mt-e-CAFs and normalized to values found in fl-e-CAFs matrices. n = 3 biological repeats with three technical replicates per biological repeat. h Polarized light imaging and quantification of picrosirius red-stained collagen matrices remodeled by fl-e-CAFs or by mt-e-CAFs. Scale bar: 100 μm, n = 3 biological repeats with three technical replicates per biological repeat. i Representative maximum projections of Second Harmonic Generation (SHG) signal in collagen matrices remodeled by fl-e-CAFs and by mt-e-CAFs and quantification of SHG signal intensity through a 60 μm z-stack and at intensity peak (bar graph inset). Scale bar: 100 μm, n = 3 biological repeats with three technical replicates per biological repeat. j Representative single-plane SHG images of collagen matrices generated by fl-e-CAFs or by mt-e-CAFs and quantification of GLCM correlation (bar graph inset depicts GLCM mean correlation normalized to mean correlation found in fl-e-CAFs matrices). Scale bar: 100 μm, n = 3 biological repeats with three technical replicates per biological repeat. k Representative images of picrosirius red staining imaged with brightfield or polarized light and quantification of collagen birefringence signal in primary KPflC and KPC tumors. n = 7 for KPflC tumors and n = 9 for KPC tumors. Data are presented as mean values with SEM. *p < 0.05, **p < 0.01, ***p < 0.001, ****p < 0.0001

