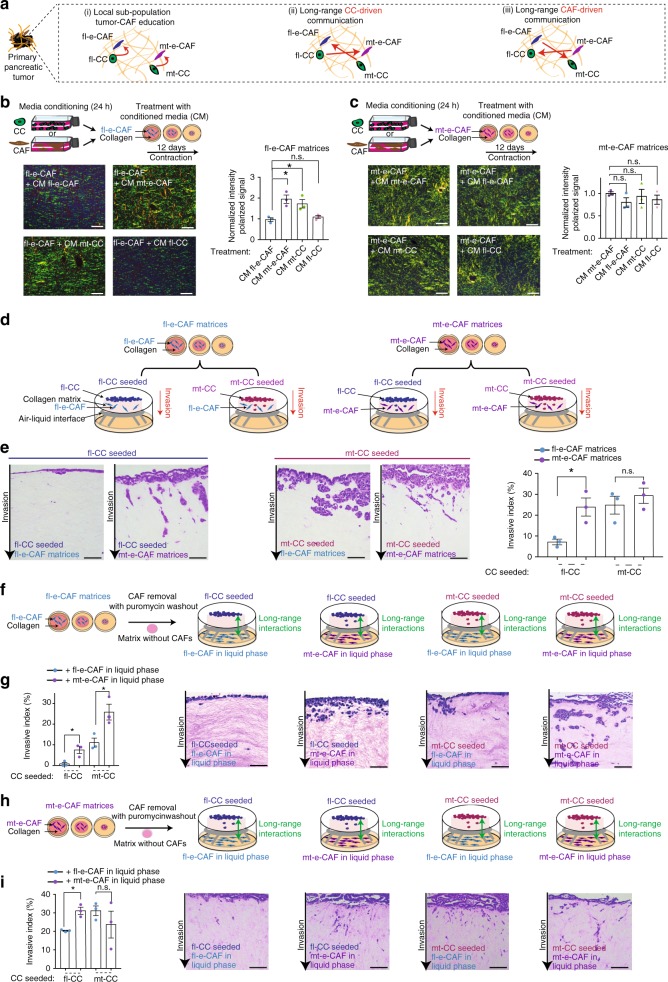
Fig. 2.
mt-cells further potentiate fl-e-CAFs and mt-e-CAFs to induce fl-CCs invasion. a Representation of (i) local crosstalk between cancer cells and CAFs, (ii) long-range CC driven interactions, and (iii) long-range CAF-driven interactions between cancer cells and CAFs across a primary pancreatic tumor. b Top panel: representation of media conditioning driven by cancer cells or by CAFs and treatment of fl-e-CAFs with conditioned media (CM) during remodeling of a collagen matrix over 12 days. Lower panel: representative images and quantification of collagen birefringence in fl-e-CAFs matrices treated with CM generated by fl-e-CAFs, mt-e-CAFs, mt-CCs or fl-CCs, and normalized to treatment with CM from fl-e-CAFs. Scale bar: 100 μm. c Top panel: representation of media conditioning driven by cancer cells or by CAFs and treatment of mt-e-CAFs with CM during remodeling of a collagen matrix over 12 days. Lower panel: representative images and quantification of collagen birefringence in mt-e-CAFs matrices treated with CM generated by mt-e-CAFs, fl-e-CAFs, mt-CCs or fl-CCs, and normalized to treatment with CM from mt-e-CAFs. Scale bar: 100 μm. d Schematic representation of 3D CAF-based organotypic invasion assay. e Representative H&E staining of organotypic invasion assay and quantification of invasive index for fl-CCs or mt-CCs invading into fl-e-CAF matrices (blue bars) or into mt-e-CAFs matrices (purple bars). Scale bar: 200 μm. f Schematic representation of 3D organotypic invasion assay including pharmaceutical removal of CAFs following matrix establishment and continuous media conditioning driven by CAFs during cancer cell invasion. g Quantification of invasive index and representative images of H&E stained organotypic matrices with fl-CCs and mt-CCs invading into matrices generated by fl-e-CAFs and with continuous media conditioning driven by fl-e-CAFs or by mt-e-CAFs during invasion. Scale bar: 200 μm. h Schematic representation, i quantification of invasive index and representative images of H&E stained organotypic matrices with fl-CCs and mt-CCs invading into matrices generated by mt-e-CAFs and with continuous media conditioning driven by fl-e-CAFs or by mt-e-CAFs during cancer cell invasion. Scale bar: 200 μm. Contraction and invasion assays were conducted in three biological repeats with three technical replicates per biological repeat. Individual data points are presented with mean values and SEM. *p < 0.05

