Fig. 3.
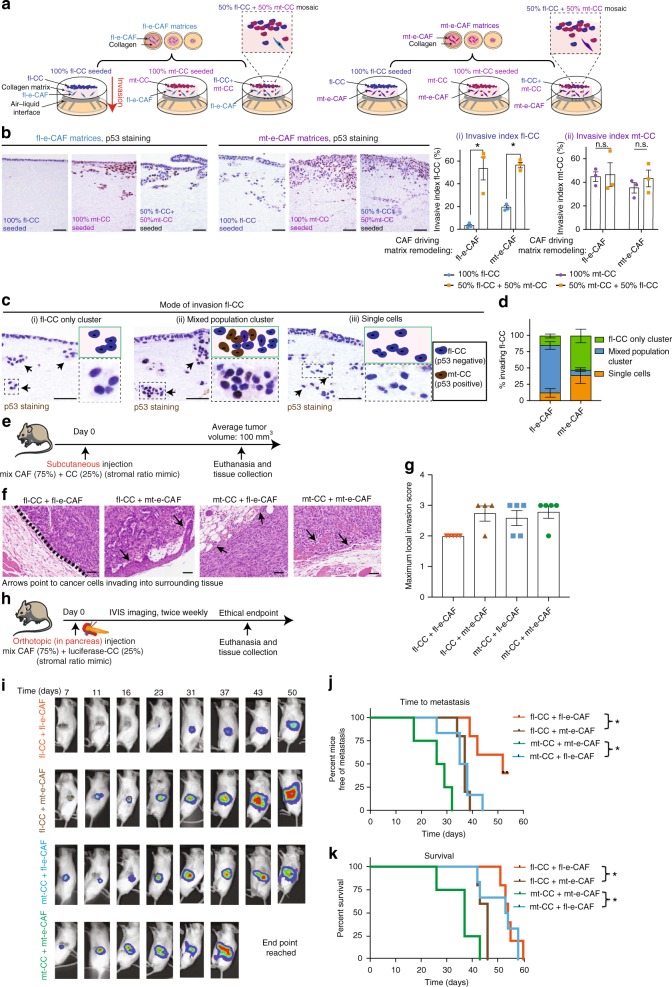
mt-CCs act as carrier for fl-CCs and mt-e-CAFs drive local invasion and metastasis in vivo. a Schematic representation of 3D organotypic invasion assays with mosaic cancer cell cultures invading into matrices generated by fl-e-CAFs or mt-e-CAFs, b representative images of p53 staining (PAb421 antibody) and quantification of invasive index of (i) fl-CCs and (ii) mt-CCs invading alone or in a mosaic culture (fl-CCs + mt-CCs 50:50 ratio) into fl-e-CAF matrices or into mt-e-CAF matrices. Scale bar: 200 μm, n = 3 biological repeats with three technical replicates per biological repeat. c Representative images and schematic representation of p53 staining (PAb421 antibody) in organotypic matrices and depicting fl-CCs invading either as a cluster of fl-CCs only (i), as a mosaic cluster with mt-CCs (ii) or as single fl-CCs (iii). Scale bar: 200 μm. d Quantification of the mode of invasion followed by fl-CCs during invasion into fl-e-CAF matrices or into mt-e-CAF matrices and in the presence or absence of mt-CCs, n = 3 biological repeats with three technical replicates per repeat. e Schematic representation of subcutaneous injection of cancer cells (25%) with CAFs (75%), tumor growth and mouse euthanasia followed by tissue collection. f Representative H&E images, and g quantification of mean maximum score of cancer cell local invasion into the surrounding tissue in subcutaneous xenografts generated by fl-CCs injected with fl-e-CAFs (orange dots, n = 5 mice) or injected with mt-e-CAFs (brown dots, n = 4 mice) and in subcutaneous xenografts generated by mt-CCs injected with fl-e-CAFs (blue dots, n = 5 mice) or with mt-e-CAFs (green dots, n = 5 mice). Scale bar: 200 μm. h Schematic representation of orthotopic (in pancreas) injection of 50 luciferase-expressing CCs (fl-CCs or mt-CCs) with 150 CAFs (fl-e-CAFs or mt-e-CAFs) and IVIS whole body monitoring of tumor growth and metastatic spread. i Representative images of whole body IVIS imaging in mice bearing orthotopic xenografts, and j Kaplan–Meier survival analysis of time to metastasis and of k survival of mice orthotopically injected with fl-CCs + fl-e-CAFs (n = 5 mice); fl-CCs + mt-e-CAFs (n = 5 mice); mt-CCs + fl-e-CAFs (n = 6 mice) or with mt-CCs + mt-e-CAFs (n = 4 mice). Individual data points are presented with mean values and SEM. *p < 0.05

