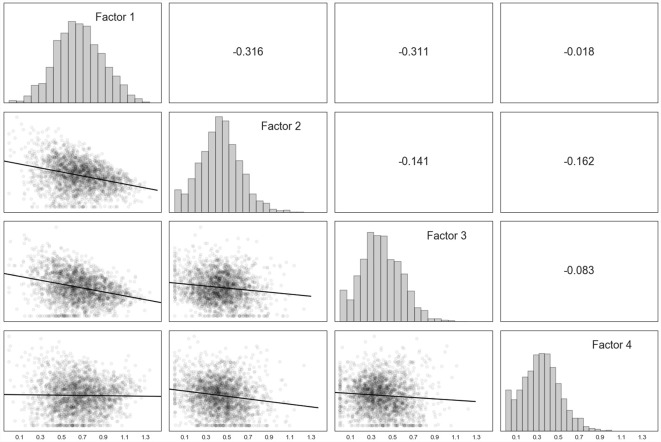
Figure 3.
Factor correlation matrix. Note. On the diagonal from top left to bottom right, frequencies for each of the four factors derived from Part C (brain-related) items identified by the non-negative matrix factorization. In the lower triangle, bivariate scatter plots for each combination of the four factors, along with the line of best fit. In the upper triangle, Pearson correlation coefficients for each combination of the factors. Factor 1 = Self-Regulation, Factor 2 = Sensory Integration, Factor 3 = Cognitive, Factor 4 = Relational.

