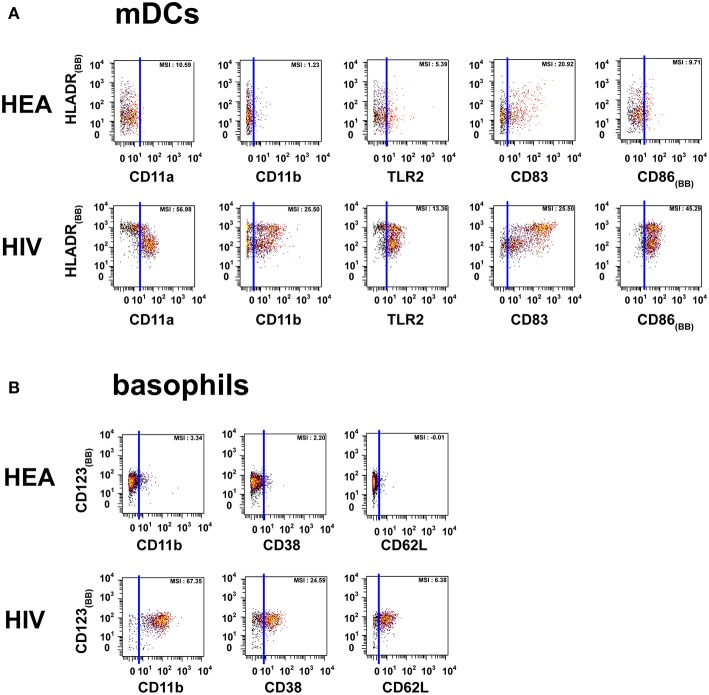
Figure 2.
Dot plots representing the phenotypes of mDCs and basophils from HIV-infected patients and healthy donors. Cell clusters corresponding to mDCs were isolated based on the same SPADE analysis presented in Figure 1. The same approach was used to isolate basophils. (A) Biplot representations showing the co-expression of HLADR and either CD11a, CD11b, CD83, CD86, or TLR2 by mDC populations. (B) Biplot representations showing the co-expression of CD123 and either CD11b, CD38, or CD62L by basophil populations. Blue lines were added to better visualize the difference in marker expression between healthy donors and HIV-infected patients. MSI represents the mean (MSI) of the markers in the X axes. “BB” in subscript indicates backbone markers.

