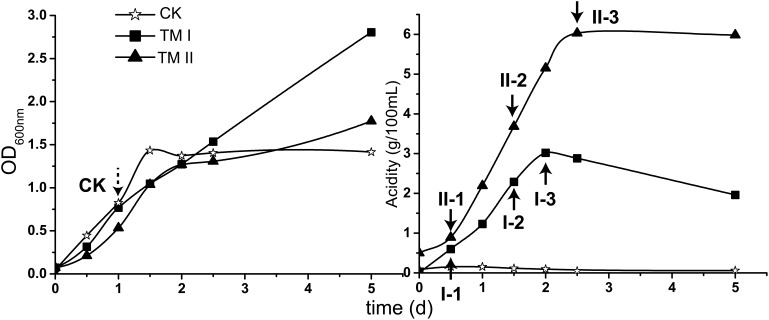
FIGURE 1.
Growth (shown in OD600 nm value) and acidity of the culture together with the sampling point in this study. CK sample was collected when the culture in CK medium reached exponential phase (dash-lined arrow); the treatment samples were collected when the acetic acid fermentation entered initial, mid and final stages in TM I (I-1, I-2, and I-3) and TM II (II-1, II-2, and II-3) media, respectively (solid-lined arrow).

