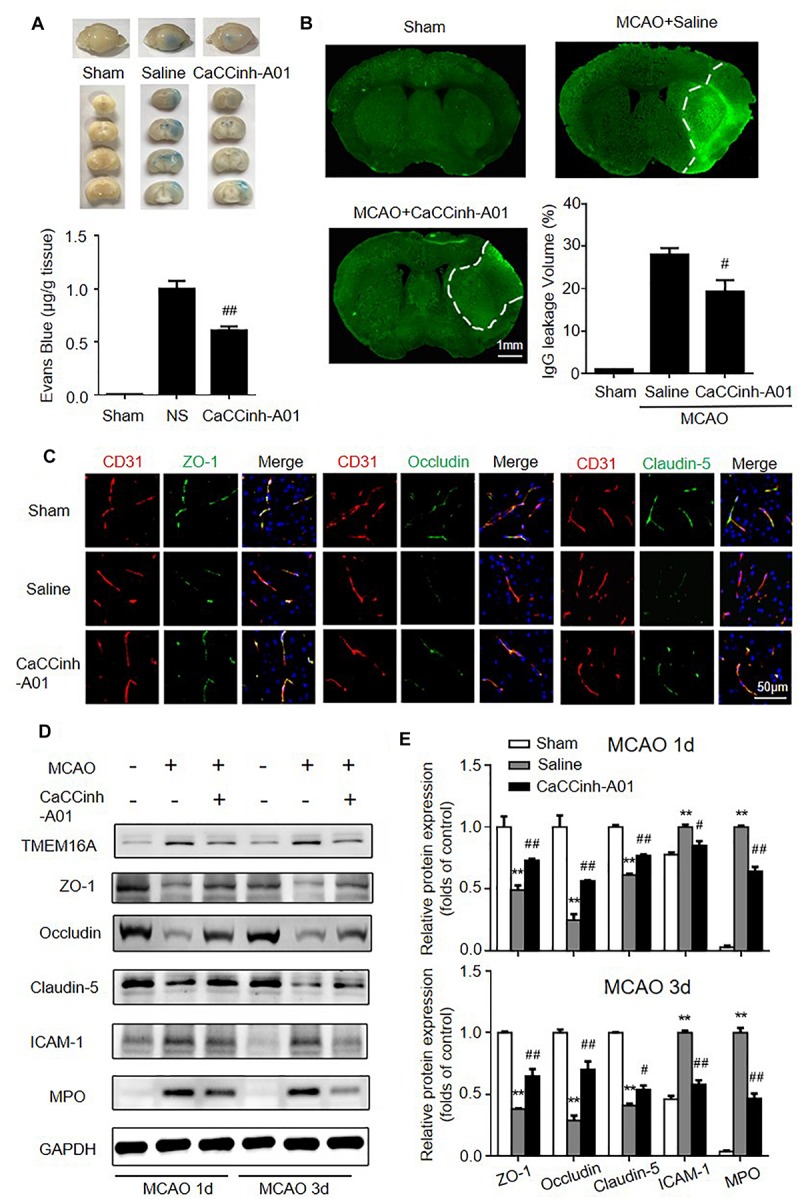
FIGURE 3.

TMEM16A inhibition attenuated BBB disruption after ischemic stroke. (A) Evans blue staining and (B) IgG extravasation in sham-operated groups, MCAO-Saline groups and MCAO-Caccinh-A01 groups on day 3 after MCAO (bar = 1 mm). (C) Representative immunofluorescence staining of ZO-1, occludin and claudin-5 on day 3 after MCAO (bar = 50 μm). (D,E) Representative Western blotting results of TMEM16A, ZO-1, occludin, claudin-5, ICAM-1 and MPO on days 1 and 3 after MCAO. Values are the mean ± SEM. Two asterisks indicate P < 0.01 vs. sham-operated groups. One number sign indicates P < 0.05 and two number signs indicate P < 0.01 vs. MCAO-saline groups.
