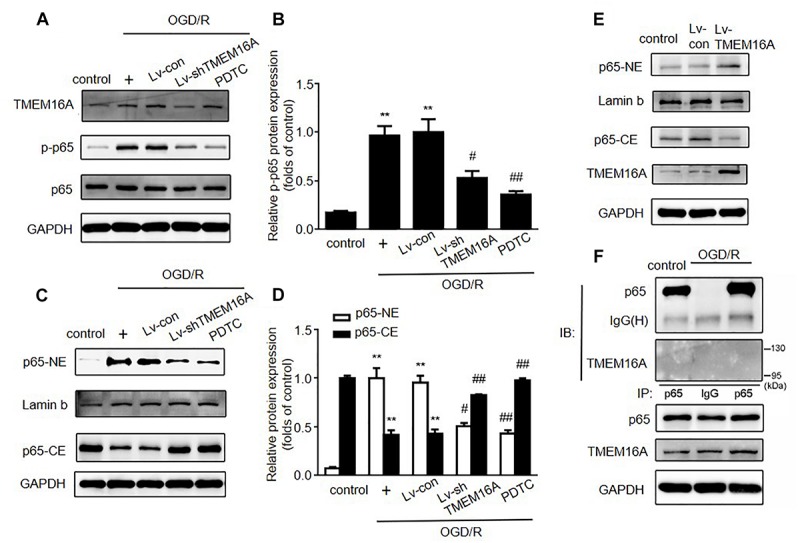
FIGURE 5.

Silencing TMEM16A suppressed the activation of the NF-κB signaling pathway. (A,B) TMEM16A, NF-κB p-p65 and NF-κB p65 protein expression following OGD/R treatments. (C–E) NF-κB p65 protein expression in the cytoplasm and nucleus following OGD/R treatments in TMEM16A knockdown and overexpressing Human Brain Microvascular Endothelial Cells. (F) The interaction between TMEM16A and NF-κB p65 by co-immunoprecipitation. Values are the mean ± SEM. Two asterisks indicate P < 0.01 vs. control groups. One number sign indicates P < 0.05 and two number signs indicate P < 0.01 vs. OGD/R alone groups.
