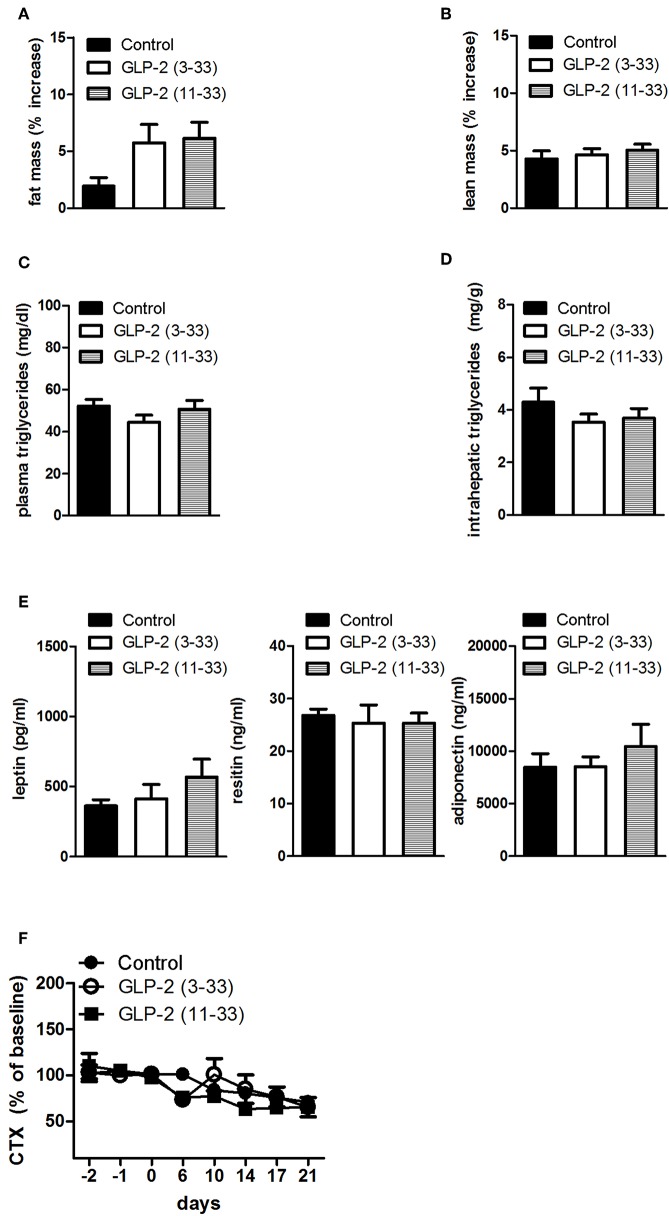
Figure 4.
Effects of the subchronic treatment with GLP-2(11-33) (25 nmol/kg b.w.), GLP-2(3-33) (25 nmol/kg b.w.) or vehicle treated on total body composition, triglycerides, adipokines, and CTX: Changes in total fat (A) and lean (B) mass, measured by NMR, plasma triglycerides (C), intrahepatic triglycerides (D), plasma adipokine levels (E), serum CTX levels (F) expressed as percent of the mean of the baseline values (days−2,−1, 0) of the individual animal. Data are mean values ± S.E.M. (n = 6 rats/group).

