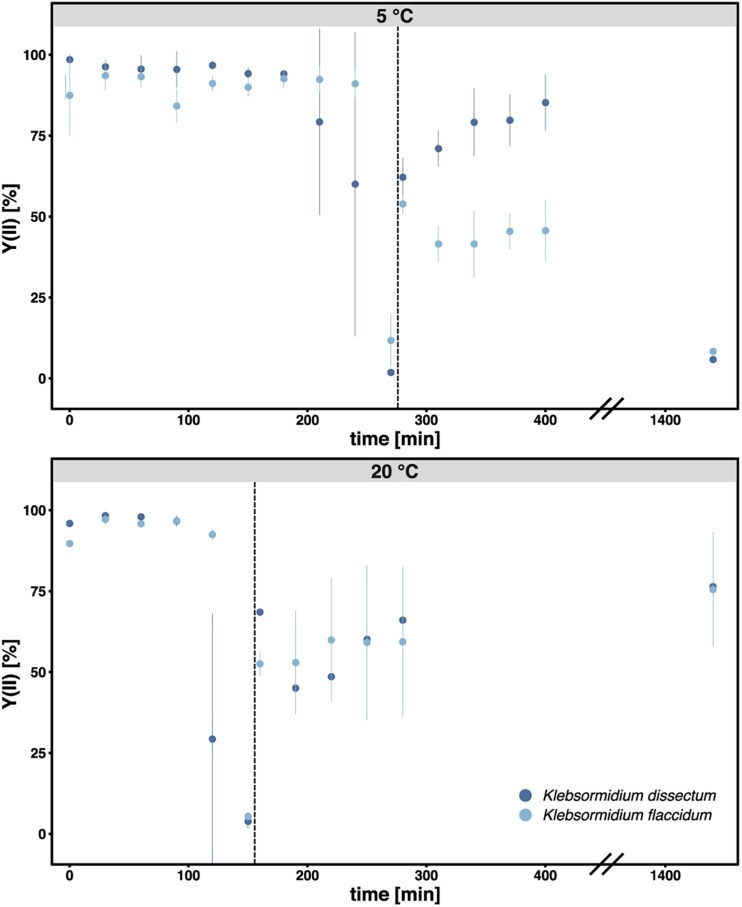
FIGURE 3.
The photosynthetic quantum yield of PS II [Y(II)] was measured over time during the course of desiccation for all samples. Each triplicate was measured three times at different positions of the filter. The bar indicates standard deviation while the dots indicate the mean value for each treatment. Dark blue: K. dissectum; light blue: K. flaccidum. The vertical lines indicate the start of the recovery phase.

