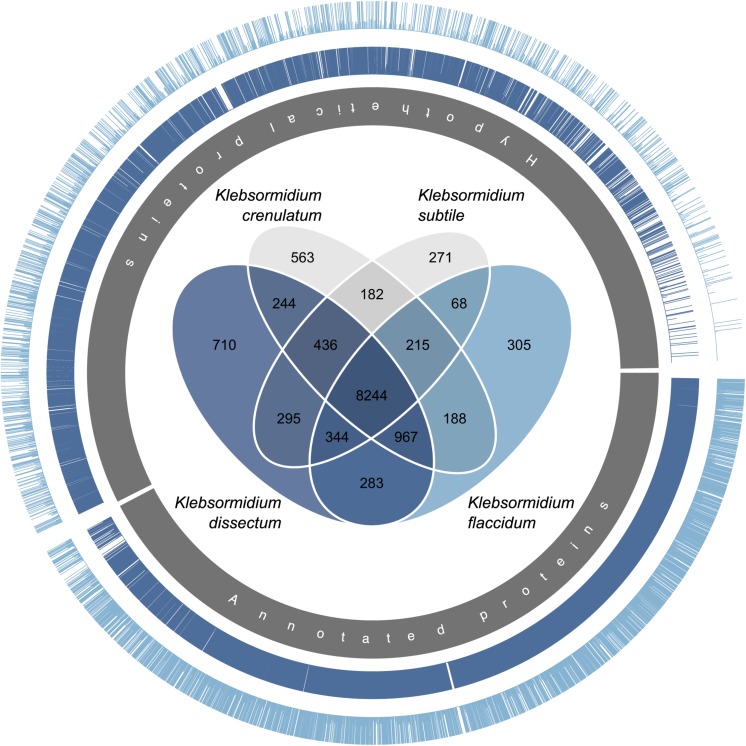
FIGURE 5.
Gene map comparing the genome of K. nitens with the transcriptomes from K. dissectum and K. flaccidum. The inner gray circle indicates the annotated and hypothetical proteins of K. nitens. Each bar in the two outer circles represents a protein of K. nitens being a BLAST top hit when the two transcriptomes were blasted against the K. nitens genome. The bar length indicates the conservation of the protein. The proteins encoded by the K. dissectum transcriptome are generally much more similar to K. nitens proteins than proteins encoded the K. flaccidum transcriptome. The Venn diagram in the center illustrates the similarity of the available Klebsormidium transcriptomes when the transcriptomes were blasted against the K. nitens genome using the BLASTN algorithm and an e-value cut-off of E –10.

