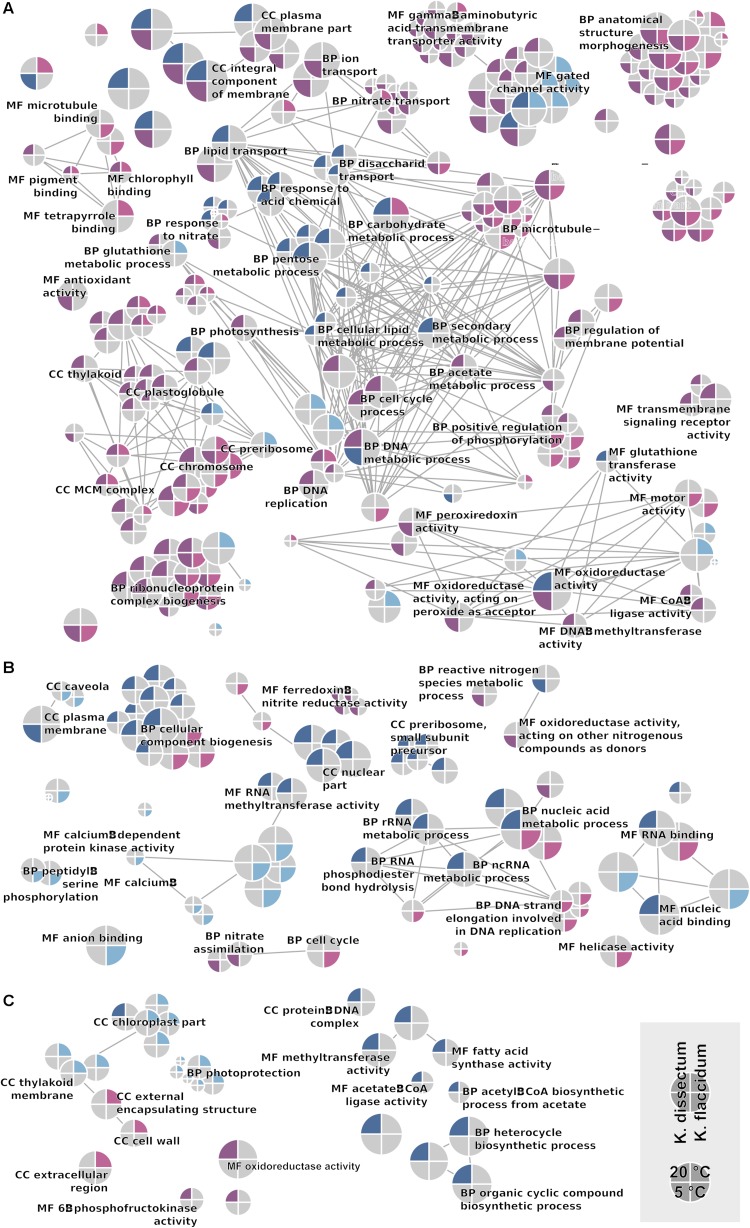
FIGURE 8.
GO network displaying all enriched categories in both Klebsormidium species. Terms regulated at 5°C are indicated as the lower half of the circle, while terms regulated at 20°C are depicted in the upper half. Upregulation and downregulation are indicated with blue and red colors. K. dissectum is on the right while K. flaccidum is on the left side. The root categories are “biological process” (BP), “molecular function” (MF), and “cellular component” (CC). Edges depict shared higher categories. (A) Comparison of control cells with desiccated cells. (B) Comparison of desiccated cells with cell rehydrated for 2 h. (C) Comparison of cells with short (2 h) and long rehydration (24 h after start of the experiment) periods.

