
Figure 3.
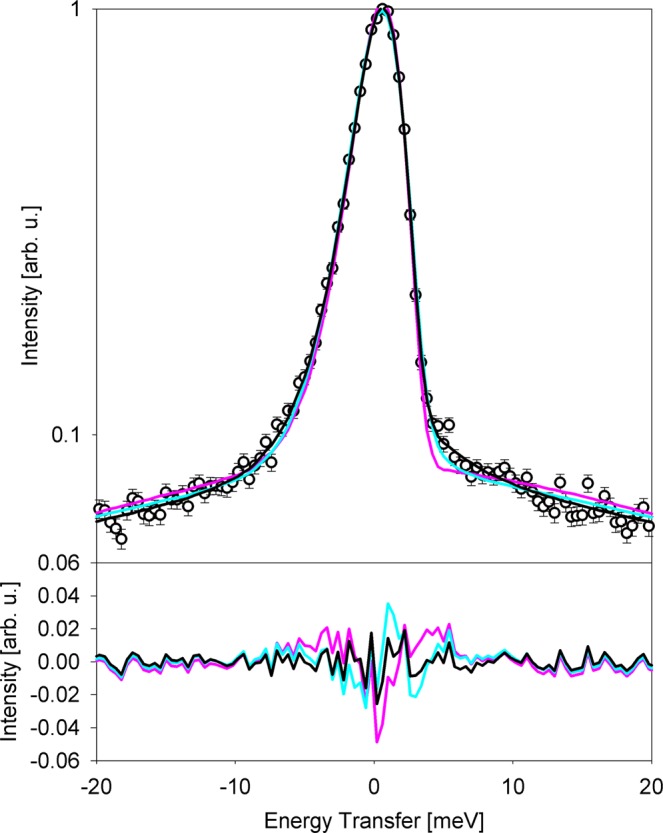
Comparison of fits obtained using different model scattering functions for millipede sample data at 290 K, Q = 0.7 Å−1 (symbols). The energy transfer range is truncated for better visibility, and the difference plots (data minus model) are shown in the bottom. Cyan lines: two Lorentzian functions (Eq. 1). Pink lines: a delta function plus a Lorentzian function (Eq. 2). Black lines: a delta function plus two Lorentzian functions (Eq. 3).