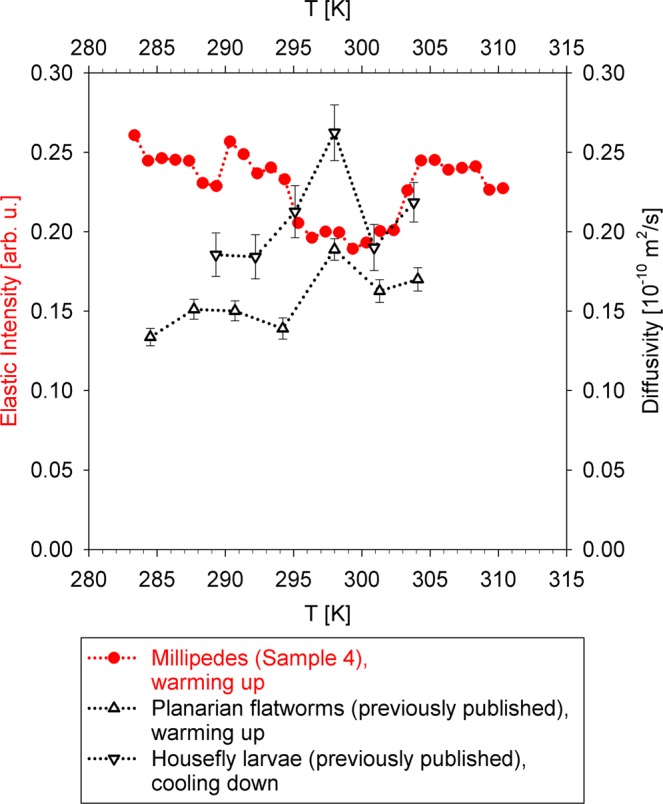
Figure 8.

Red filled circles: temperature dependence of the elastic scattering intensity (values shown on the left axis) from millipede sample on warming up at 0.2 K/min. Error bars are within the symbols. Open up-triangles: microscopic diffusivity (values shown on the right axis) measured for planarian flatworms on warming up3. Open down-triangles: microscopic diffusivity measured for housefly larvae on cooling down4. Dotted lines are guide for the eye. The elastic scattering intensity data were summed up for 0.25 Å−1 < Q < 1.75 Å−1.
