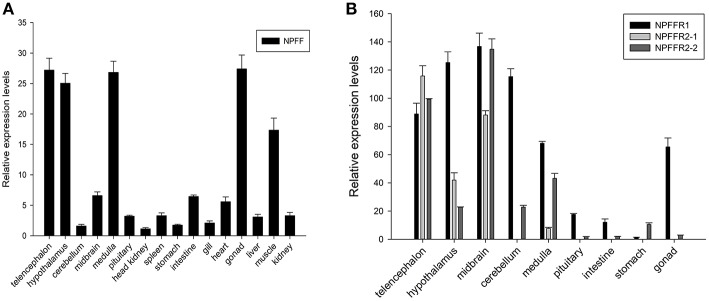
Figure 6.
Relative expression levels of the (A) npff, (B) npffr1, npffr2-1 and npffr2-2 genes in different tissues of spotted sea bass. In this study, the brain regions were divided into the telencephalon, hypothalamus, cerebellum, midbrain, medulla, and pituitary. The expression levels of the four genes were quantified by qRT-PCR and normalized by 18S rRNA. All data are presented as the mean ± S.E.M. (n = 3).

