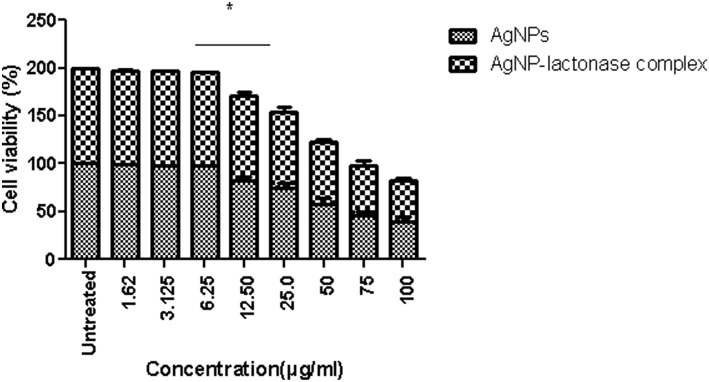
Figure 13.
Viability of macrophage cells in presence of varying concentrations (1.62–100 μg/ml) of AgNPs and AgNP-AiiA complex as determined by MTT assay. Bars above the histogram represent standard deviation of mean value of three independent values. Results of the one way ANOVA shows that effect of concentration of AgNPs and AgNP-AiiA complex from 6.25 to 12.50 μg/ml on macrophage cell line is significant (p < 0.01, *Significant).

