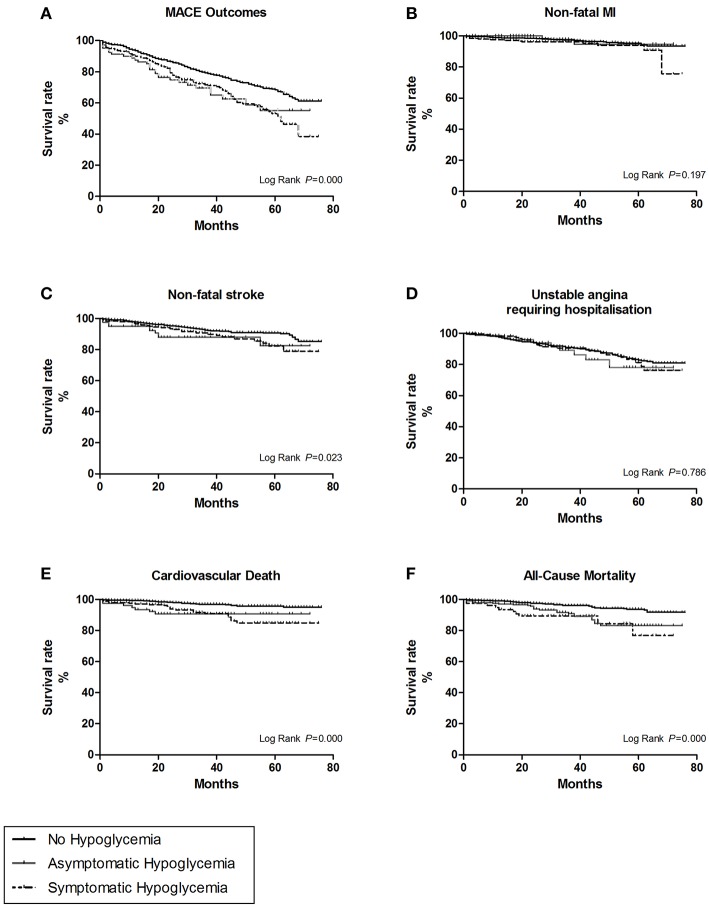
Figure 3.
The survival curves of the hypoglycemic symptoms were estimate by Kaplan-Meier method, and the homogeneity between survival curves was tested by log-rank test. (A) For overall MACE outcomes. (B) For the subtype of non-fatal myocardial infarction (MI). (C) For the subtype of non-fatal stroke. (D) For the subtype of unstable angina leading to hospitalization. (E) For the subtype of cardiovascular death. (F) For all cause-mortality.

