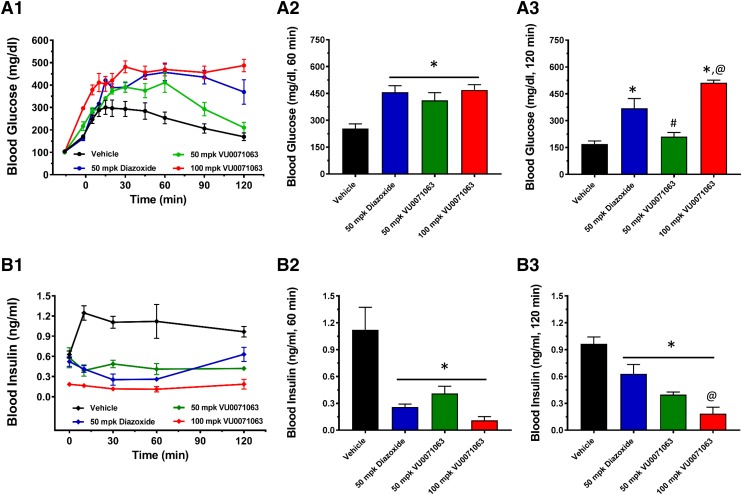
Fig. 6.
Intraperitoneal glucose tolerance test and insulin measurement. Mice were injected intraperitoneally with either vehicle, the indicated dose of diazoxide or VU0071063, followed by 1 g/kg of glucose (after 15 minutes of drug dose). Blood samples were collected from the tail vein once before and at several time intervals after the drug administration for up to 120 minutes for the measurement of glucose and insulin concentration. Time-course showing blood (A1) glucose and (B1) insulin concentration in response to drug treatments. Bar graph showing blood (A2) glucose and (B2) insulin concentrations at 60 minutes, and blood (A3) glucose and (B3) insulin concentrations at 120-minute time points. *P < 0.05 statistically significantly different than vehicle, #P < 0.05 statistically significantly different than 50 mg/kg diazoxide and 100 mg/kg VU0071063, @P < 0.05 statistically significantly different than 50 mg/kg diazoxide.

