
Figure 6.
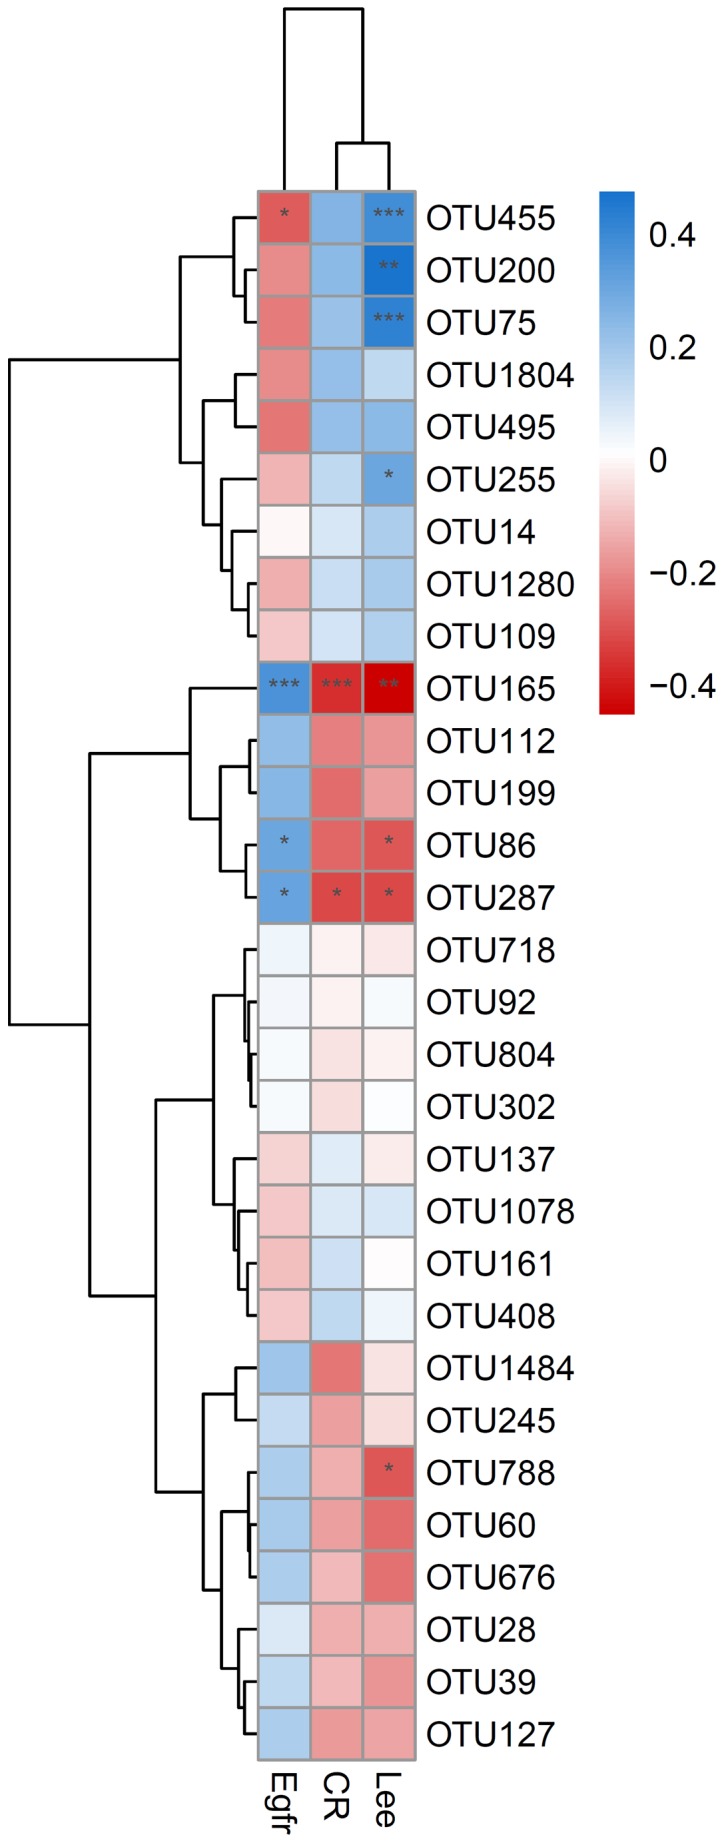
Analysis of the correlation of OTUs with the biochemical indicators sCR and eGFR. Blue indicates a positive correlation, while red indicates a negative correlation; the darker the color, the higher the correlation. OTU165 was significantly positively correlated with sCR and negatively correlated with eGFR; OTU287 was significantly positively correlated with sCR and negatively correlated with eGFR; both OTU86 and OTU455 were significantly negatively correlated with eGFR; *P<0.05, **P<0.01 and ***P<0.001. OTUs, operational taxonomic units; sCR, serum creatinine; eGFR, glomerular filtration rate.