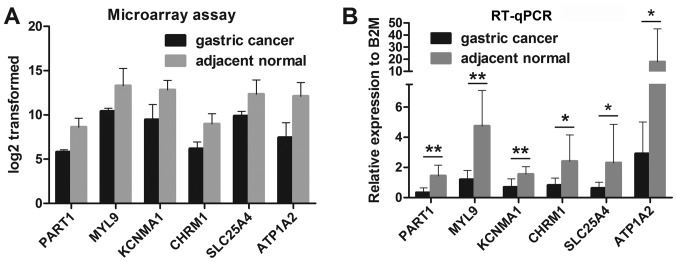
Figure 6.
Expression levels of PART1 lncRNA and associated DEmRNAs in gastric cancer tissues and adjacent normal tissues based on (A) microarray results and (B) RT-qPCR. *P<0.05 and **P<0.001, statistically significant differences and highly statistically significant differences, respectively. DE, differentially expressed.

