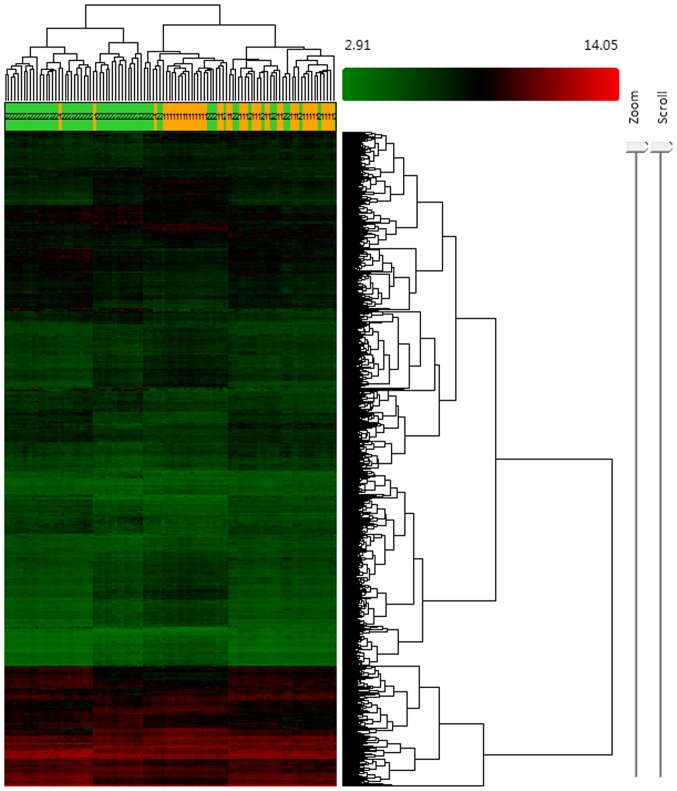
Figure 1.
Hierarchical clustering of the differentially expressed lncRNAs and mRNAs. Upregulated expression is presented in red and downregulated expression is presented in green. Each row represents an lncRNA/mRNA probe, and each column represents a tissue sample. 1 (yellow) indicates samples from the healthy control group, 2 (green) indicates samples from the asthma group. lncRNA, long non-coding RNA.

