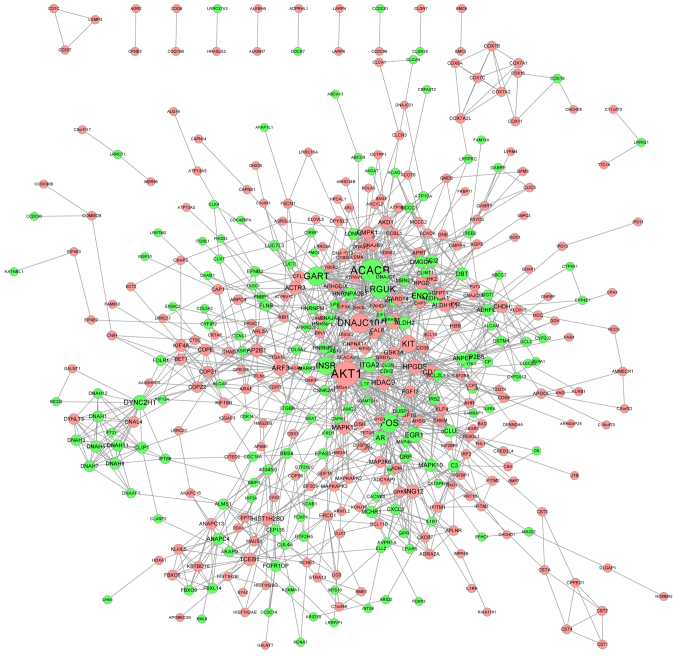
Figure 3.
PPI network of the differentially expressed genes constructed with Cytoscape software. Red nodes represent upregulated genes, while green nodes represent downregulated genes. The edges indicated the association between genes. The degree of one gene represents the number of interactions with other genes. The larger the node, the higher the connectivity. A high connectivity indicates the importance of a gene in the PPI network. PPI, protein-protein interaction.

