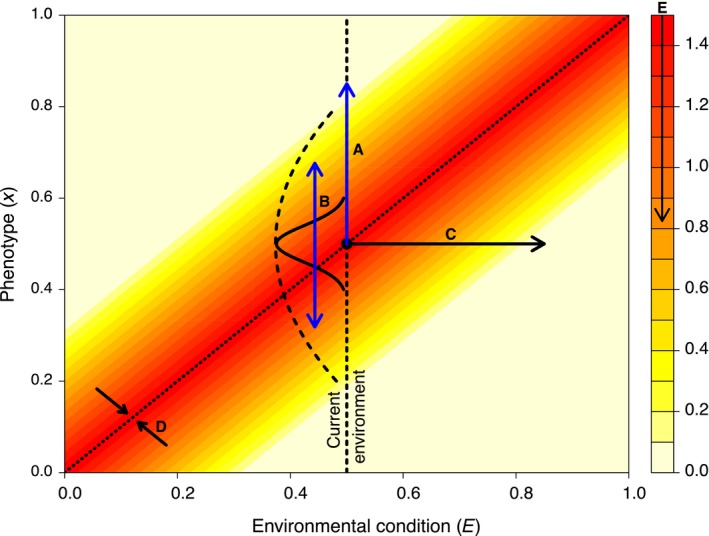
Figure 3.

A conceptual fitness surface showing various ways for mean absolute fitness to decline. Fitness is indicated by heat map colors and is shown in relation to environmental condition (x‐axis) and phenotype value (y‐axis). Under conditions shown, there exists a range of phenotype and environment values that confer maximal fitness. Scenarios causing maladaptation are represented in terms of trait distribution change (blue arrows) and environmental change (black arrows). For trait distribution change, maladaptation can arise through (A, biased arrows) resulting from change in trait mean () that reduces mean fitness or (B, imprecise arrows) increasing trait variation () e.g., due to immigration, assortative mating, mutation, maladaptive plasticity), which increases variance in fitness and thereby reduces mean fitness). For environmental change, maladaptation can arise when (c, moving target) the environmental value changes (), (D, retreating target) the fitness peak narrows ( ; e.g., due to increased competition or niche contraction) resulting in stronger stabilizing selection which in turn increases variance in fitness and thereby reduces mean fitness, or (E, degraded target) the environmental quality decreases ().
