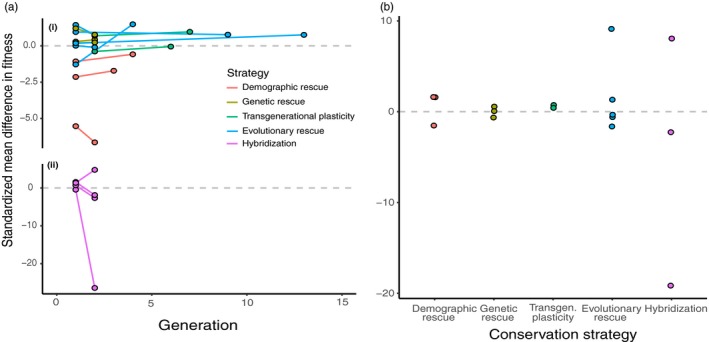
Figure 2.

Fitness responses to different conservation strategies. (a) Standardized mean differences (SMD) were calculated for fitness values measured over three time periods (1. before conservation, 2. soon after conservation, and 3. multiple generations after conservation) (Table 3). SMDs between time periods 1–2 and 2–3 are shown with respect to generation time. Because of differences in magnitude, SMDs for (ii) “hybridization” are shown separately (and using a different scale) from SMDs pertaining to (i) all other strategies. (b) The SMD was also calculated between each of these two time periods to evaluate the overall effect of each conservation strategy
