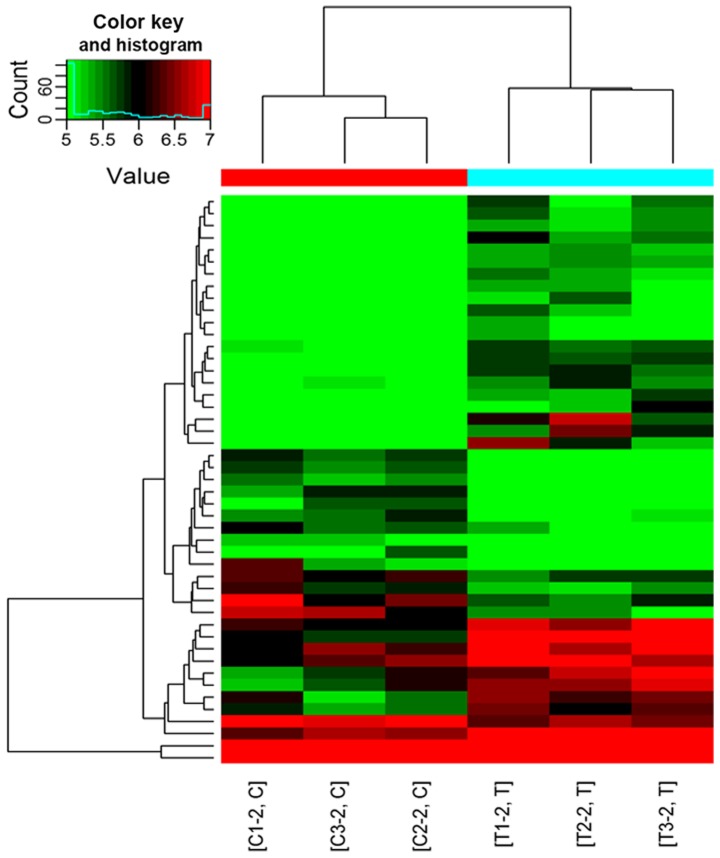
Figure 3.
Hierarchical clustering plot of differentially expressed circRNAs. Red indicates circRNAs with high expression levels and green indicates circRNAs with low expression levels. Each row represents a different circRNA and each column represents a sample. circRNA, circular RNA; T, patients with post-operative cognitive dysfunction; C, patients without post-operative cognitive dysfunction.

