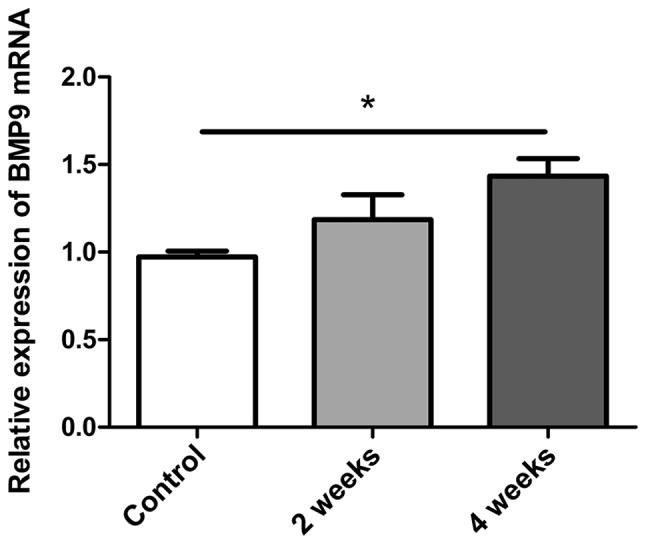
Figure 1.

Quantitative analysis of BMP-9 expression in the MCD-induced NASH mouse model. Bar graphs presenting the results of the quantitative analysis of the mRNA expression of BMP-9 over time in liver tissues obtained from MCD-induced NASH model mice. *P<0.01, as indicated. Data are presented as the mean ± standard error of the mean. BMP-9, bone morphogenetic protein-9; MCD, methionine- and choline-deficient diet; NASH, non-alcoholic steatohepatitis.
