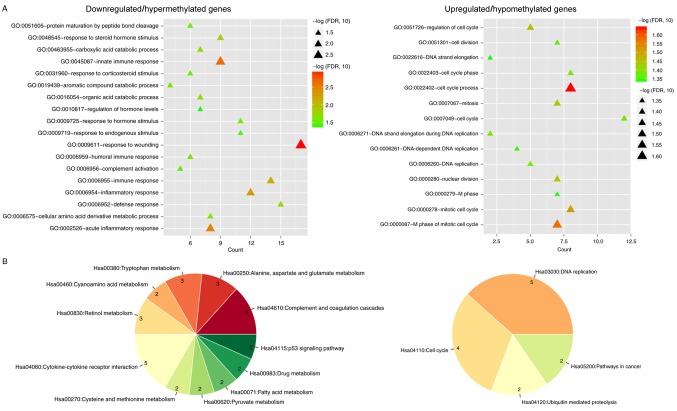
Figure 4.
GO and KEGG enrichment analyses of the methylation-related DEGs. (A) GO biological process term analysis. Triangles indicate the significance level (P-value adjusted to FDR). (B) KEGG pathway enrichment. Left, downregulated/hypermethylated DEGs; right, upregulated/hypomethylated DEGs. DEGs, differentially expressed genes; FDR, false discovery rate; GO, Gene Ontology; KEGG, Kyoto Encyclopedia of Genes and Genomes.

