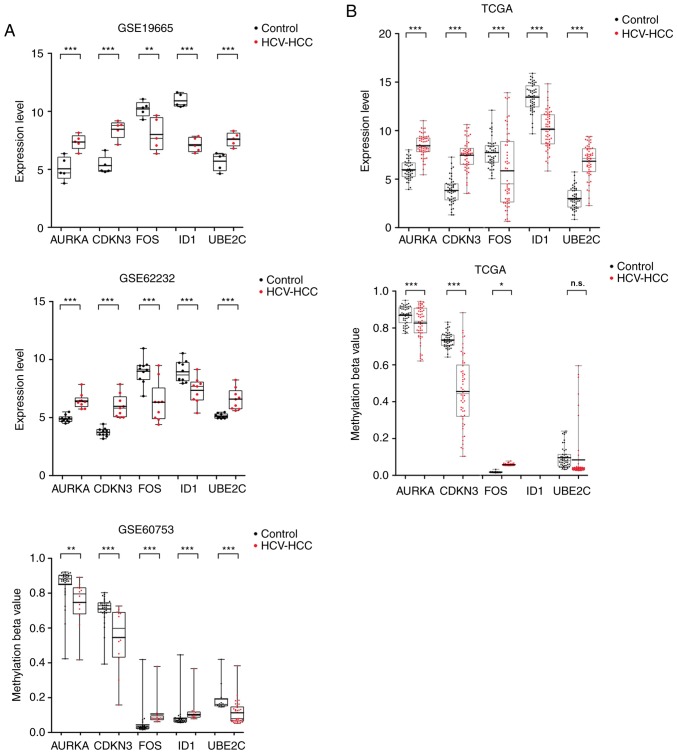
Figure 6.
Validation of the hub genes in the samples obtained from TCGA database. (A) Gene expression and methylation levels in samples of microarray datasets GSE19665 (HCV-positive HCC tissues, n=5; normal controls, n=5), GSE62232 (HCV-positive HCC tissues, n=9; normal controls, n=10) and GSE60753 (HCV-positive HCC tissues, n=29; normal controls, n=34). (B) Gene expression and methylation levels in TCGA data (HCV-positive HCC tissues, n=58; normal controls, n=50). Student's independent t-test was used to analyze the differences between HCV-positive HCC and normal controls. *P<0.05, **P<0.01 and ***P<0.001 vs. control. AURKA, aurora kinase A; CDKN3, and cyclin-dependent kinase inhibitor 3; FOS, Fos proto-oncogene, AP-1 transcription factor subunit; HCC, hepatocellular carcinoma; HCV, hepatitis C virus; ID1, inhibitor of DNA binding 1, HLH protein; UBE2C, ubiquitin conjugating enzyme E2 C; n.s., not significant; TCGA, The Cancer Genome Atlas.

