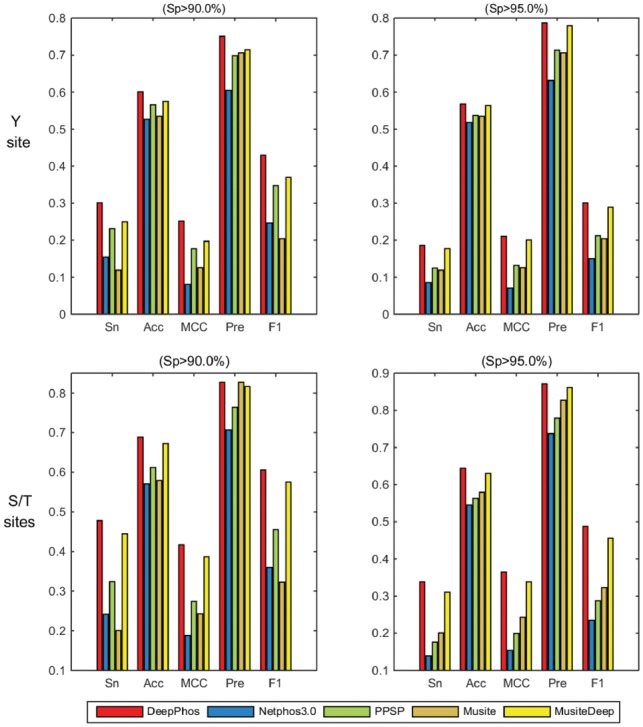
Fig. 2.

Performance comparison of different predictors for general phosphorylation S/T and Y sites prediction at the high and medium stringency levels. The left field represents the Sp values of 90%, the right part represents the Sp of 95%. The upper rows refer to the performance of Y sites, the rows under refer to the S/T sites. The Sn, Acc, MCC, Pre and F1 represent the different measurements (Color version of this figure is available at Bioinformatics online.)
